Inventory of Public Water Data


Current Inventory Selected: Federal (as of Nov 2018)

The network displays which entities are collecting water data, their mission, and the broad purposes for collecting those data. Click on an entity to highlight their network. Select a data purpose to see which entities collect water data for those purposes. A table of selections is located below the network.


Select an entity:    

Select a Data Purpose:    

Public entities collecting water data based on drop-down selections:

The types of water data collected were categorized by the basic components of a water budget: quantity, quality, and use. Water flows through infrastructure, both natural and built, which is included as an additional category. Types of water data were further sub-divided within each component of the water budget as defined here. This categorization is arbitrary and other categorizations may be used when creating an inventory.


A network was created to illustrate the types of data provided by different data platforms. The lines connecting data types with data platforms do not necessarily reflect sharing of data between entities. Rather, it shows which entities are collecting similar types of data.

You can highlight entities and platforms in the network by selecting from the filter panel on the right. You may select by entity, data type, and openness metrics. A table of selected nodes will be created below the graph. See the Openness Scorecard tab for more details on openness metrics.


Data Platform         Data: Quantity     Data: Quality     Data: Use     Data: Infrastructure

Filter network and create table

Data platform:

Data category:  

Findability

Ease of finding data:  

Method for finding data:  

Accessibility

Ease of obtaining data:  

How data are obtained:  

Interoperability & Reusability

File type:  

Data definitions:  

Metadata types:  

Update frequency:  

Length of data available:  

Water data platforms based on drop-down menu selections

The heat map shows which types of water data (rows) can be found at each data platform (columns). The bar charts below summarize the frequency of data collection (sums the rows of the heat map) and which data platforms provide the greatest variety of water-related data (sums the columns of the heat map).

Heat map showing who provides what data

What types of data are most often collected?

Which platforms provide the greatest variety of water-related data?

The mission of the Internet of Water is to build a dynamic and voluntary network of communities and institutions to facilitate the opening, sharing, and integration of water data and information. This network will connect data producers, hubs, and users to enable the discovery, accessibility, and usability of water data and information.

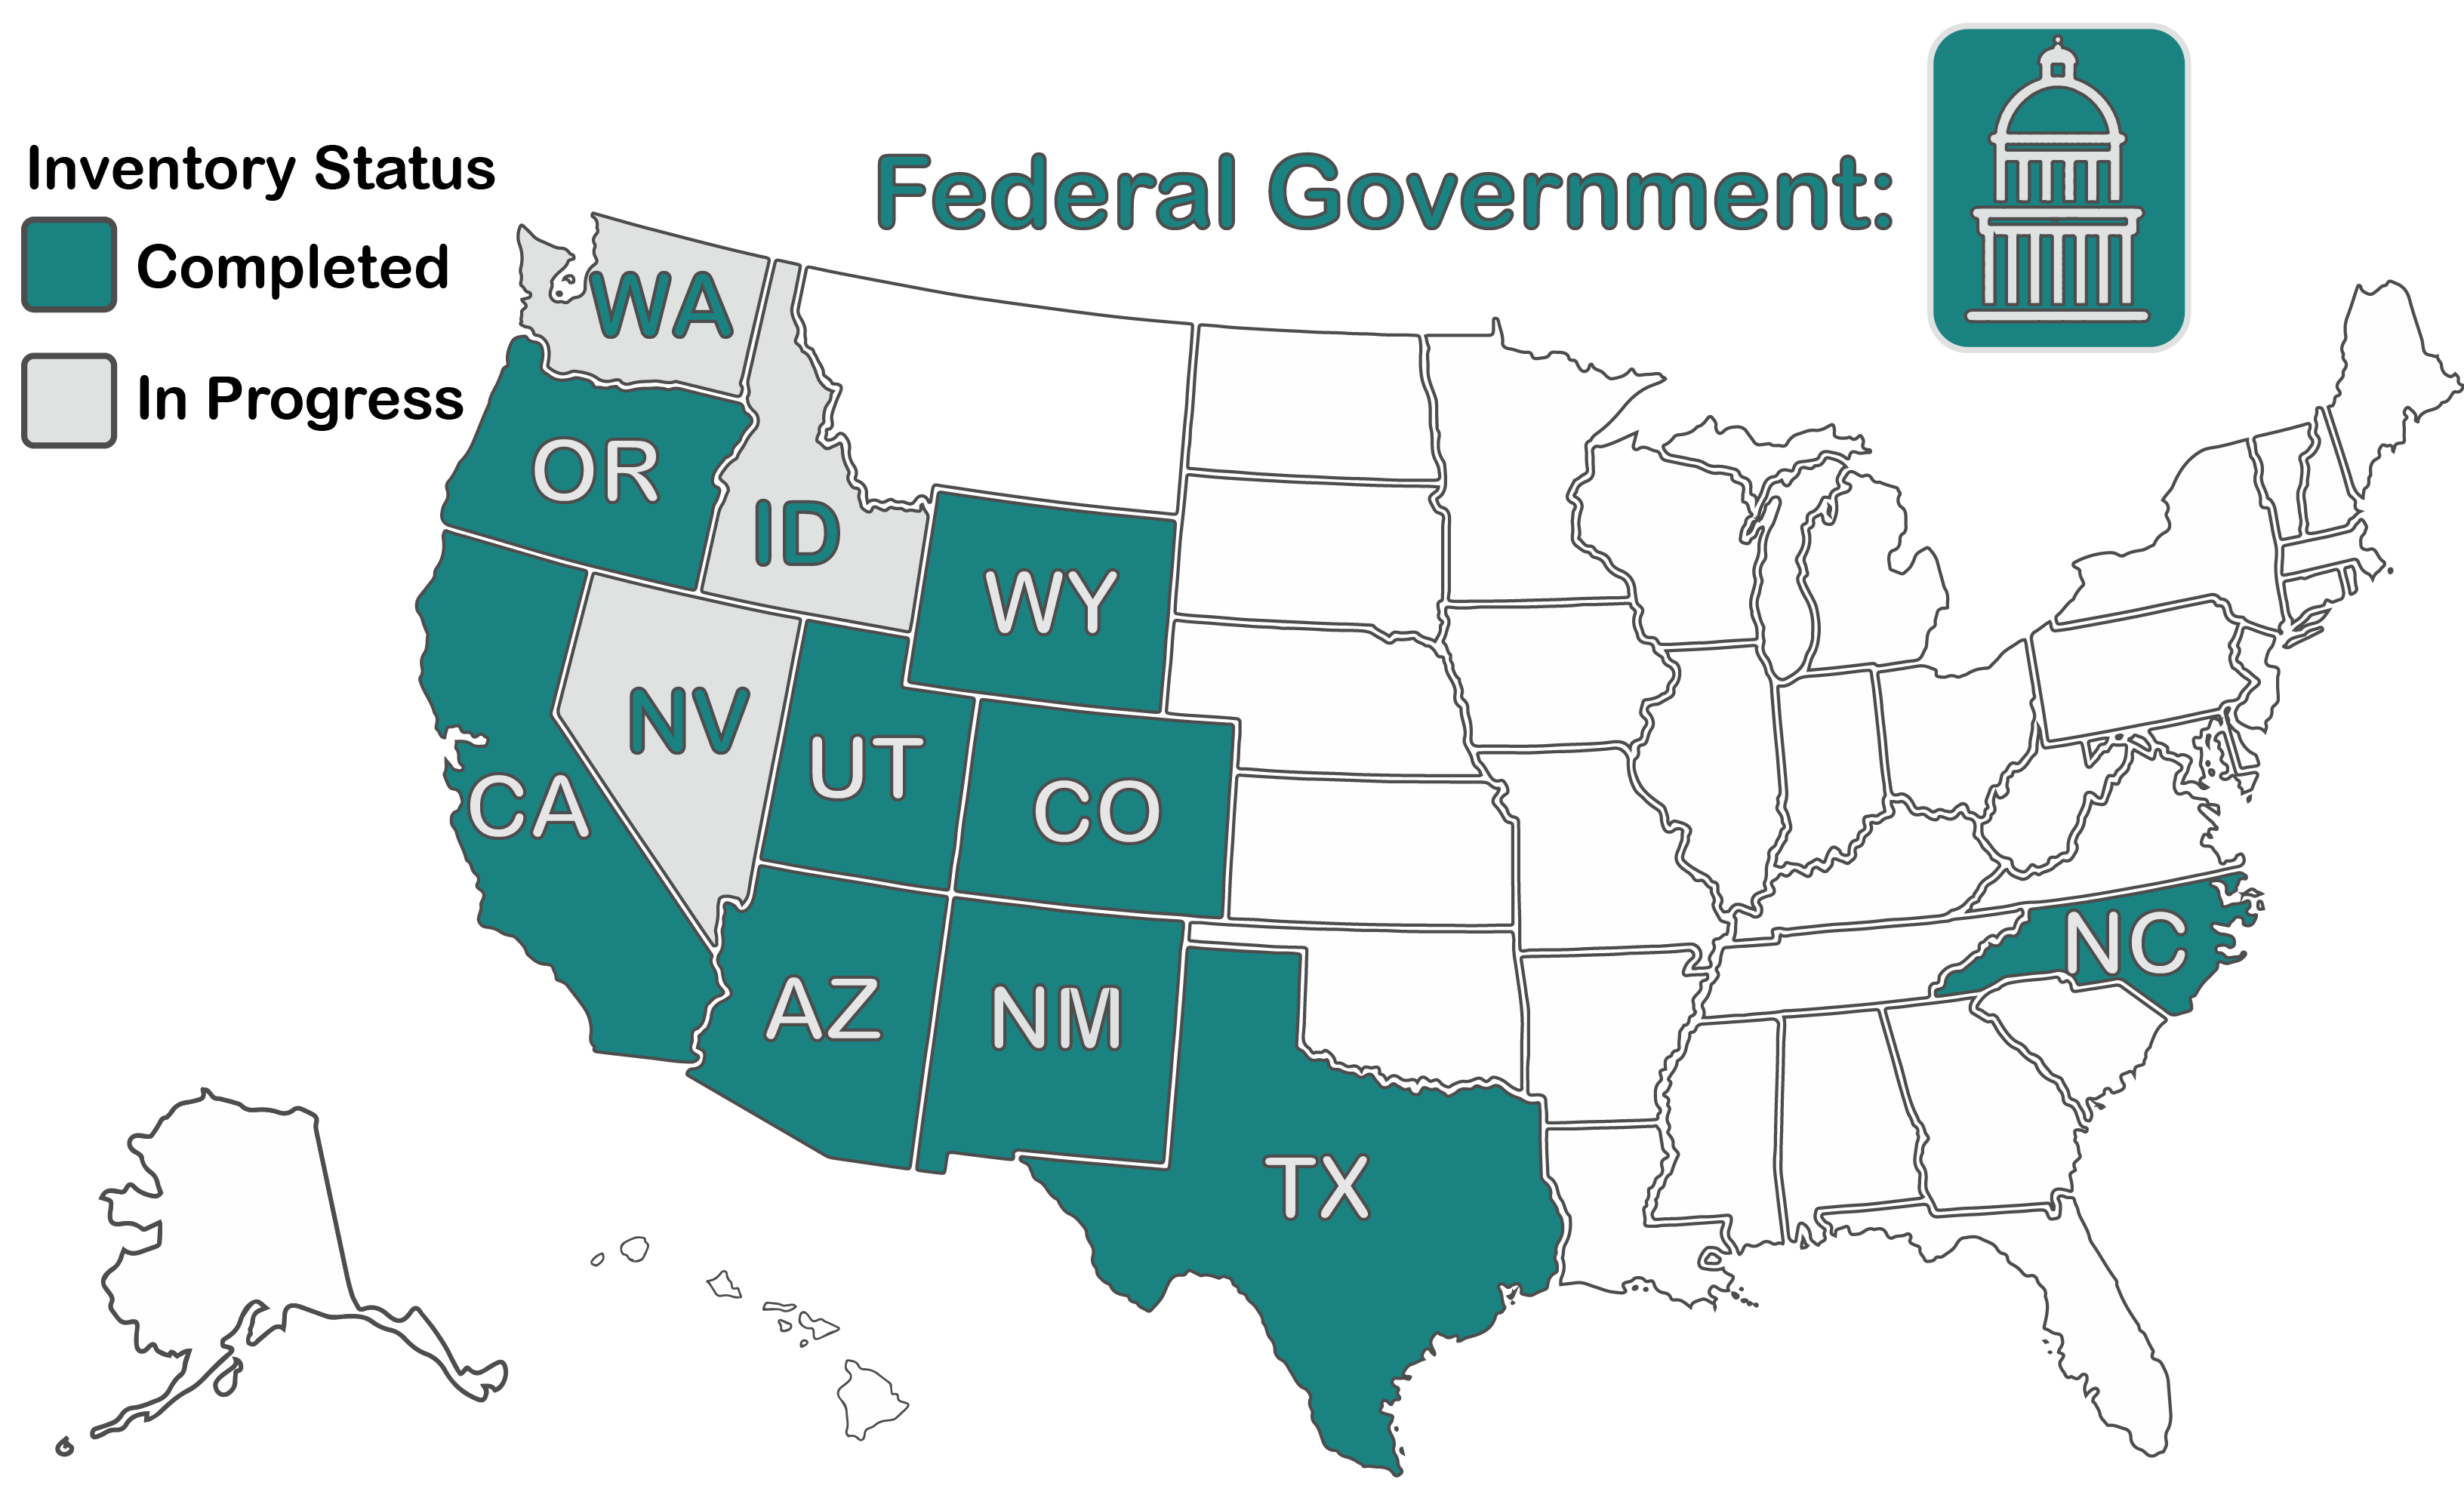
A team of students has been inventorying federal and state governments to understand what water data are currently collected and how those data are discovered, accessed, and made usable. These inventories are quickly outdated and are meant to represent a fairly informed public data user's experience.

  • Entities Collecting Water Data shows the organizational network of public entities collecting water data and the primary purpose(s) of collecting those data.
  • Water Data Platforms shows which entities are collecting similar types of water data. The network can be filtered by data findability, accessibility, and interoperability metrics.
  • Summary of Water Data Collected highlight which data types are collected by which entities, the types of data most often collected, and which entities provide access to the greatest variety of water data.
  • Openness Scorecard provide a relative score to compare how findable, accessible, interoperable and reusable (FAIR) data are within and across inventories. This scoring can be used as a template for self-diagnostic tools and understanding how to improve openness.

The methods, template, and data are all available for download at the bottom of the website. The inventory is a living document and may be periodically updated.


Select an inventory and click on the above tabs to see results:


Data discoverability, accessibility, and usability were categorized and scored from low to high with the assumption that maximum openness (being able to find, download all data, and link to similar data) was the ideal. Note that usability is weighted more heavily than discoverability and accessibility. Scoring is as follows (click on plus icon or text to expand lists):

  • Findability considers whether data were easy to discover within an entities website.
    • Ease of finding data: Data are not discoverable (0), are not searchable (1), have some searchability (2), have robust searchability (3).
    • Method for finding data: Unknown (0), clicking on web links (1), catalog (2), and/or on a map (2). Sometimes multiple methods of discoverability were used. We took the mean score.
  • Accessibility considers how easy it is to access all the data.
    • Ease of obtaining data: Data are not accessible (0), data require permission, software, or training (not guaranteed access) (1), registration is required with guaranteed access (2), or data are fully accessible (3).
    • Method for obtaining data: Unknown (0), links to the data source or copy and paste (1), individual export (2), batch or full export (3), ftp (4), and/or web services (5). The sum of the scores were normalized by the number of methods provided to access data. If a platform links directly to the data, the download method was included; however, if it is a general link requiring a fresh search, the score remains 1.
  • Interoperability and Reusability considers how easy it is to put the data to immediate use for different purposes.
    • File type: Data are unknown (0), data are not machine readable (eg. pdf, jpg) (1), data may be machine readable (zip), data are machine readable with proprietary software (eg. excel, word, shapefile) (3), data are machine readable with open software (eg., json, csv, txt) (5). The maximum score was taken when multiple file formats were present.
    • Data dictionary: Data dictionary was not found (0), some data had a dictionary (1), all data had a dictionary (2).
    • Metadata are present: Metadata presence was unknown or not found (0), metadata were provided in a non-machine readable format (1), metadata were machine readable with proprietary software (2), or metadata were machine readable with open software (3).
    • Metadata types: Metadata were not available (0), administrative metadata provided (1), descriptive metadata provided (1), and/or structural metadata provided (1). The score is the sum of the metadata types provided.
    • Metadata standards: Metadata presence was unknown or not found, or metadata standards not listed (0), some data provided the metadata standard used (1), all data provided the metadata standard used (2).
    • Frequency of data udpates: The frequency of updates is unknown (0), irregular (1), yearly or higher (2), monthly or higher (3), and/or daily or higher (4). This assumes that high update frequency is the ideal, which is not the case of all data types or purposes. The maximum score was used when multiple update frequencies were present.
    • Length of data available: Unknown (0), not applicable to data type (1), current data only (2), limited record available (3), and/or period of record available (4). This assumes that the full record of data is ideal, which is often not the case for operational purposes. The maximum score was used when multiple lengths of record were present.

All scores were made relative to the maximum available score such that 0 is the lowest, and 100 the highest, score possible. Select a metric to see how different entities performed within and across inventories.

This inventory provides one method for assessing data FAIRness (Findable, Accessible, Interoperable, and Reusable). Another method for assessing FAIRNESS is provided by the FAIR metrics group and could also be adopted and used in a public water data inventory.

Select metrics to display:


Platform Scores by Entity

Select Inventories

Compare Inventory Scores

Overall Inventory Scores

Federal
Arizona
California
Colorado
New Mexico
North Carolina
Oregon
Texas
Utah
Wyoming

Scores for data findability, accessibility, and interoperability