Drought Data Advancements, a Decade in the Making
By: Corey Davis, Assistant State Climatologist, State Climate Office of North Carolina
January 2022
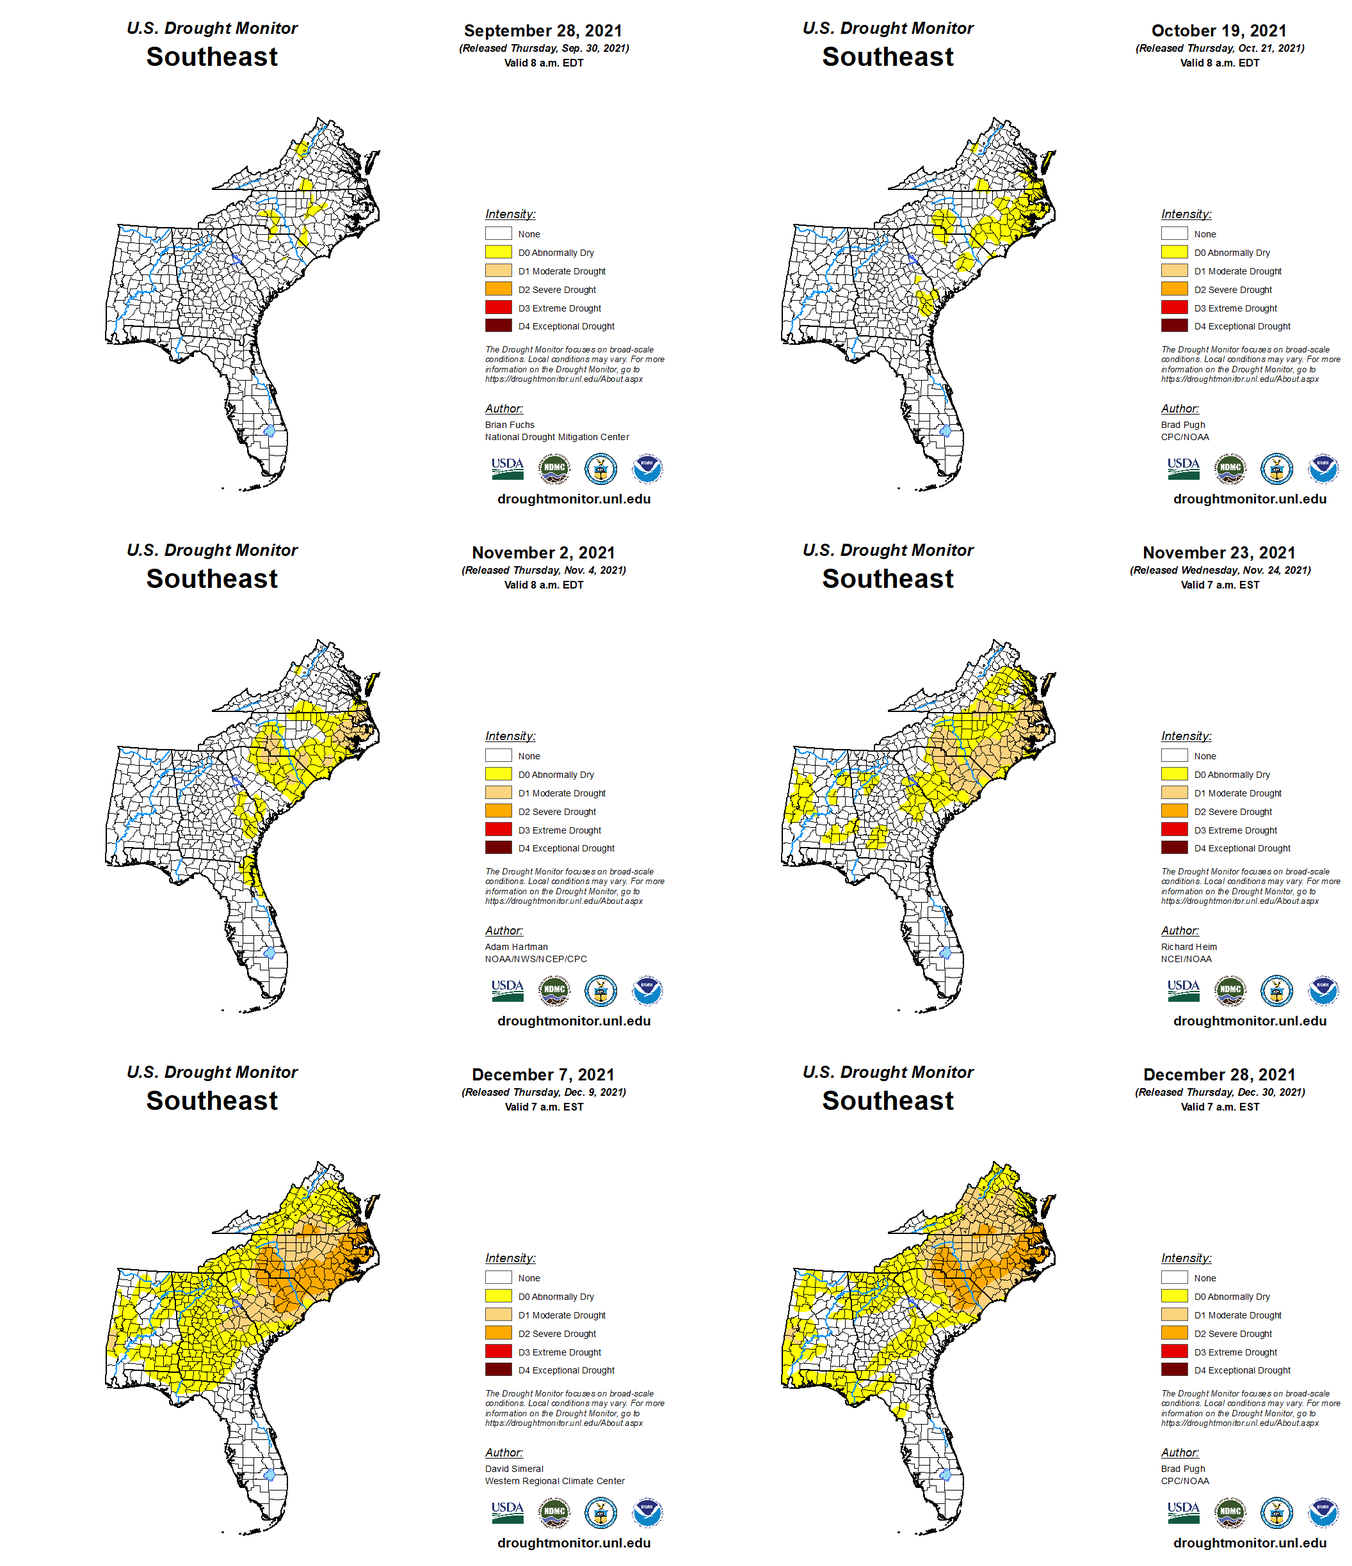
“This was the first time that at least half of the state had been in Severe Drought or worse since July 1, 2008.”
Better Collaboration
One thing that hasn’t changed, at least in North Carolina, is who is doing that monitoring work. Per a legislative statute passed in the wake of the 1999-2002 drought, the NC Drought Management Advisory Council (DMAC) is responsible for tracking conditions across the state and issuing state-level drought advisories. In 2008, the DMAC’s role and membership were further codified following the state’s drought of record.
The DMAC also makes recommendations to the US Drought Monitor, the national drought map whose weekly classifications inform the disbursement of federal agriculture relief aid according to the US Farm Bill. Many water supply managers also base their low inflow protocols and water use restrictions on the US Drought Monitor.
DMAC contributors are technical experts in fields related to drought and drought management who can offer context about current conditions and insights about impacts. Members include state agencies and organizations such as the Division of Water Resources, NC Forest Service, Cooperative Extension, and the State Climate Office; reservoir operators such as the US Army Corps of Engineers and Duke Energy; and federal agencies such as the US Geological Survey and the National Weather Service.
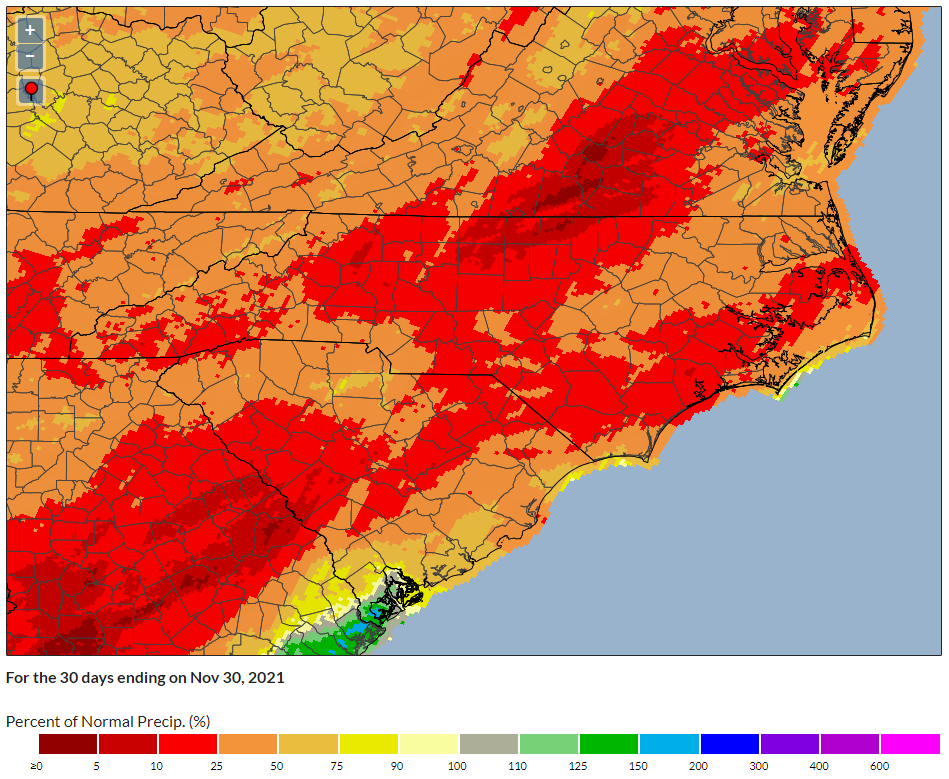
That variety of input informs a comprehensive assessment of conditions, fitting with the US Drought Monitor’s convergence of evidence approach. For example, seasonal precipitation totals last fall were less than 25% of the normal amount in some areas, which was consistent with streamflows below the historical 25th percentile. Sectoral impacts such as wildfire activity and depleted topsoil moisture further confirmed the presence of drought in parts of the state.

That’s where we find the first big change since 2008: better collaboration with our neighbors. We know drought doesn’t stop at state lines, so having experts across our borders helps us paint the most accurate picture of drought. Our discussions have evolved to include hydrologists from local National Weather Service offices in the Carolinas and Virginia, and the state climate offices in South Carolina and Tennessee.
Along with providing a consistent voice for our region to the US Drought Monitor, this collaboration has the added bonus of keeping us aware of emerging droughts in surrounding states so we’re better prepared for worsening conditions in our own state. Late last summer, parts of the southern Piedmont and Sandhills in North Carolina were among the first areas to dry out, and knowing how conditions were evolving in South Carolina helped us connect the dots in a coordinated effort as drought conditions expanded.
Better Data
The data we look at each week has also evolved over time, and one of the biggest changes has been the increasing resolution of precipitation data. When the US Drought Monitor was established in 1999, its early maps typically relied on a single drought indicator – the Palmer Drought Severity Index. This index data was available at a fairly coarse resolution, either aggregated over multi-county climate divisions or interpolated between weather station estimates.
The past 13 years have seen the development of high-resolution gridded precipitation datasets and drought indices built on multi-sensor precipitation estimates or radar-estimated precipitation totals calibrated using surface-based rain gauges. At a roughly 4-kilometer resolution, this dataset can show locally heavy rain from showers or thunderstorms that surface rain gauges may miss. It can also help us identify the driest areas during already dry times, such as parts of the northern Piedmont that received less than a tenth of an inch of rain last November.

These tools have been invaluable assets for drought monitoring, both in North Carolina and in other states. With that utility in mind, the next iteration of this tool is on the horizon. It will be hosted by the Southern Regional Climate Center, which is in the process of revamping the Integrated Water Portal and updating its underlying datasets.
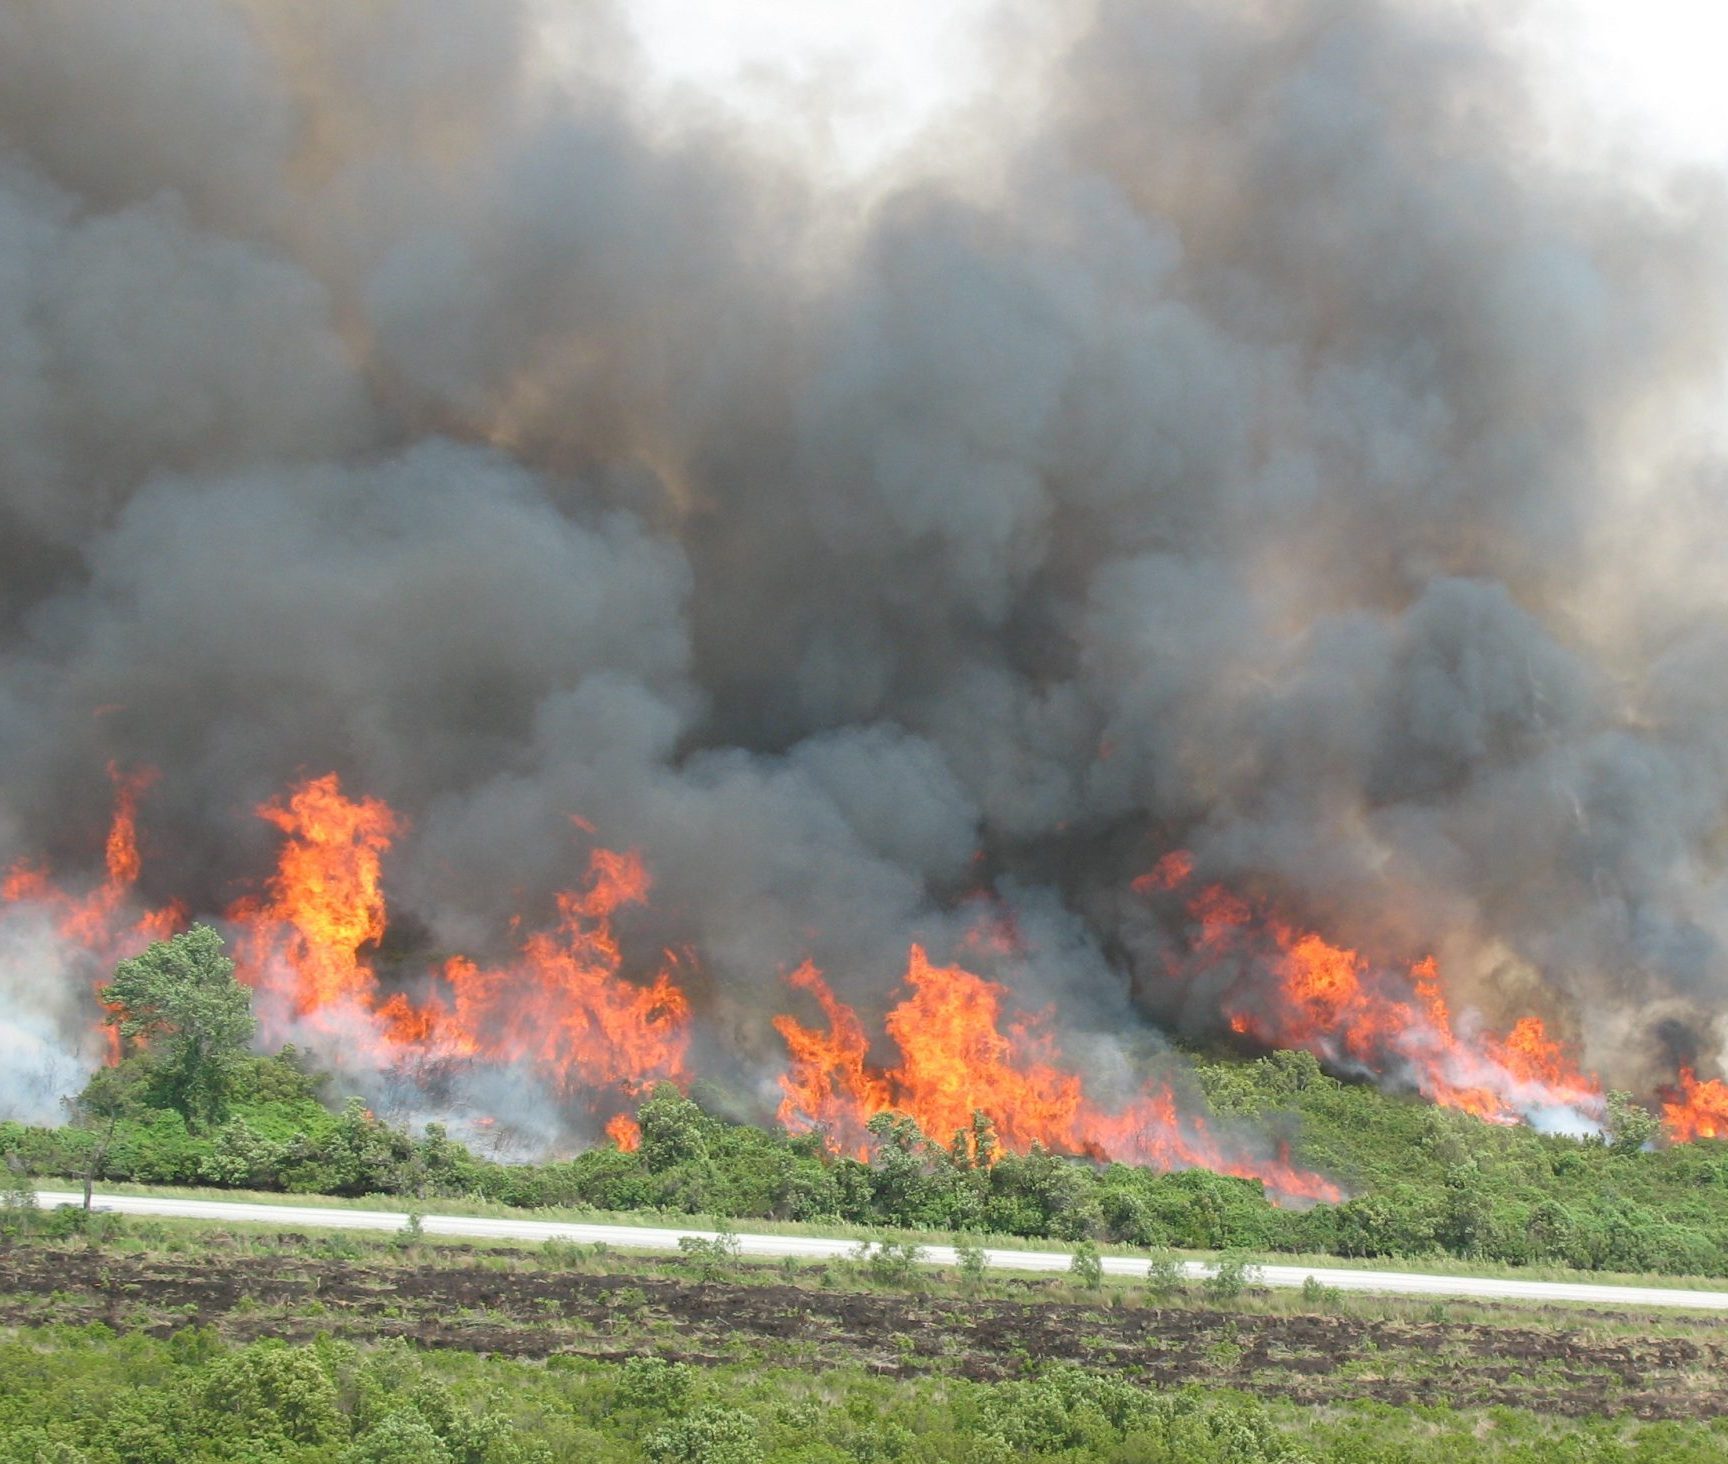
At the State Climate Office, we recently wrapped up an experimental monitoring project at four sites with organic soils, including the Pocosin Lakes National Wildlife Refuge – the location of the 40,000-acre Evans Road fire in 2008. This project revealed some of the challenges with maintaining these sites – such as inconsistent communications with remote parts of the coast and interference from curious wildlife like black bears – but also highlighted the value of the data these sites can provide. Organic soil monitoring at these sites allowed us to examine emerging dryness with depth, from 2 centimeters to a full meter beneath the ground.


Beginning in 2012, researchers at the USGS South Atlantic Water Science Center developed the Coastal Salinity Index, which places the observed salinity content of coastal waterways into a quantitative historical context, consistent with the US Drought Monitor’s percentile-based classification scheme.
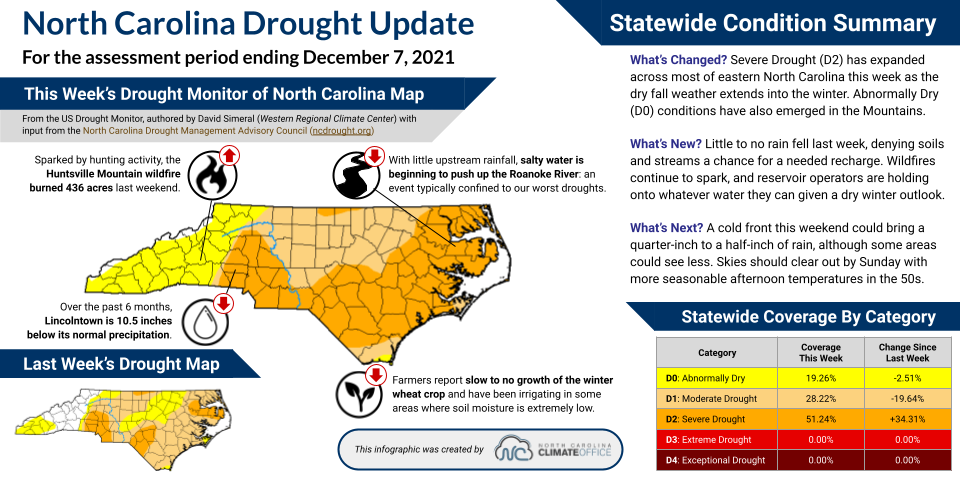
Early last December, the Roanoke River gauge near Plymouth, NC, showed salinity levels below the 10th percentile, or the equivalent of Severe Drought (D2). This observation, combined with precipitation datasets and other known impacts, ultimately helped justify the introduction and expansion of the Severe Drought classification across eastern North Carolina.
We review these reports on the DMAC calls, and they help validate our precipitation and drought indices by illustrating on-the-ground impacts and week-to-week degradation or improvement. For example, a report from southern Wake County in early December described conditions that supported the introduction of Moderate Drought (D1) in that area:
Better Communication
During past droughts, we’ve learned a lot about the difficulties and shortcomings of sharing drought information, and we’re making improvements to drought communications based on the findings of a recent stakeholder engagement effort. From 2018 through 2020, the State Climate Office and the Carolinas Integrated Sciences and Assessments partnered on a NOAA-funded project aimed at evaluating and refining drought communications with decision-makers in the agriculture, forestry, and water resources sectors.
A key finding was that drought status information, including the US Drought Monitor, is not often considered transparent. Through systematic feedback with project stakeholders, we developed and continue to create drought update infographics to highlight weekly changes to the state drought map and the impacts being observed. These graphics are shared on the DMAC website, on our State Climate Office Twitter account, and via an email listserv.

Evaluations conducted toward the end of our project revealed that stakeholders were using our drought and weather updates to maintain situational awareness, inform colleagues and constituents about evolving conditions, and assist with their own planning during times of drought.
Better Prepared
The availability of weather and drought information has become even more important during our recent dry spell. By applying the lessons learned from past droughts and turning those insights into usable datasets and monitoring resources, we have greatly improved the state’s ability to track drought conditions. As a result, we are better prepared to manage the current drought conditions than we were when the last major drought hit the state in 2008.
While statewide droughts haven’t been common in recent years, drought research has been ongoing. Those advancements helped us to anticipate, monitor, and prepare for the current drought event as it developed. During the wet years, it can be difficult to devote valuable resources toward drought research, but those investments are paying off now. The foresight of the DMAC, along with the dedication of researchers and community science contributors, has allowed us to continue to improve our drought monitoring capacity and to be better prepared for new climate conditions as they arise.

Photo Credits
Header Photo: Christiane Nuetzel, Unsplash
Footer Photo: Landon Parenteau, Unsplash
