Business Model Maturity Index methods
Last Updated November 26, 2018
The Business Model Maturity Index method, proposed by Dell, assesses the value of data based on their relative contribution to a final outcome. This top-down approach relies on use cases and allows for estimating the value of data before (and/or after) an outcome is realized.
The Business Model Maturity Index method values data relative to how much they influenced an outcome by making a better-informed decision. This method progresses through identifying a desired outcome, developing use cases to achieve that outcome, and the relative contribution of data to each use case. The Business Model Maturity Index’s top-down approach prioritizes which data to collect based on the desired outcome (Figure 1).
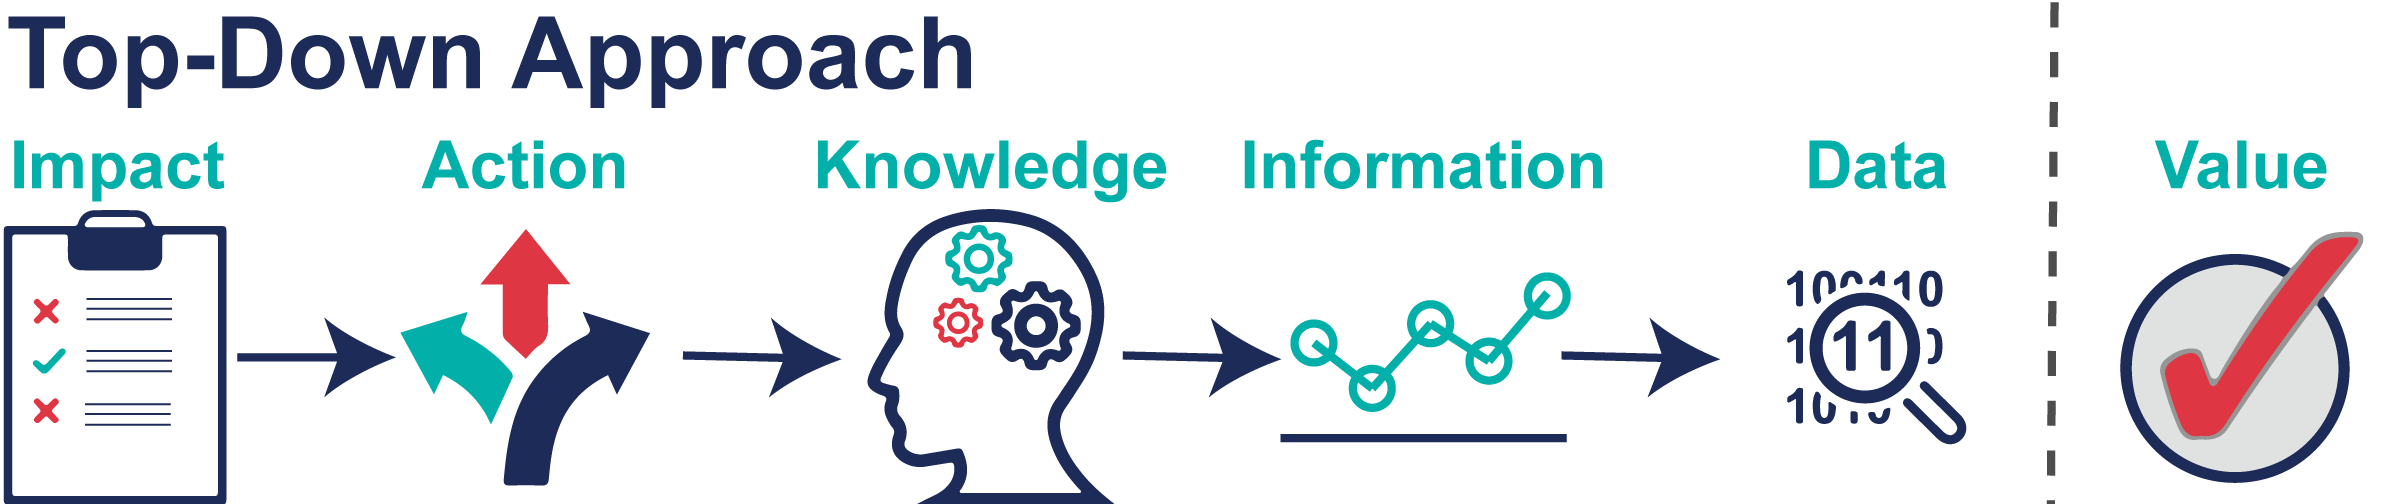
Figure 1: The Business Model Maturity Index takes a top-down approach to estimate the contribution of data to achieving the desired impact.
How can the same data become increasingly valuable?
The value of data is tied to its impact. A desired impact is more achievable when data are transformed from descriptive (requires expertise to translate to action) to prescriptive (minimizes the expertise gap) information. Let’s explore the difference between descriptive, predictive, and prescriptive information.
- Descriptive Analytics uses data to understand the past in order to provide context for current conditions. This step is informative.
- Example: Why is my electricity bill higher than normal? Comparing current to historical conditions, we see that July’s temperature was 10°F warmer than average.
- Predictive Analytics uses data to forecast what is likely to happen in the future. Knowing the probability of future events may inform current decisions. This step adds the likelihood of future conditions.
- Example: Is my electricity bill going to remain as high next month? Combining different weather data together, the forecast indicates a 70% probability that August will be just as hot and my electricity bill will likely be just as high.
- Prescriptive Analytics uses data to inform what actions are needed to achieve a desired outcome. Now that you know the likelihood of future conditions, this step provides precise actions that ideally lead to a desired impact.
- Example: How can I lower my energy bill by $50? Combining probabilities of future temperatures with thermostat settings and billing, I learn that I can reduce my energy bill by $50 if I set the thermostat 5 degrees lower between 8 am and 5 pm Monday to Friday.
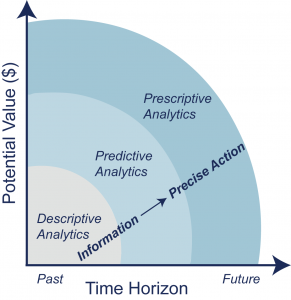 Box Figure: Progression in value from descriptive to prescriptive analytics to inform decision-making.
- Example: How can I lower my energy bill by $50? Combining probabilities of future temperatures with thermostat settings and billing, I learn that I can reduce my energy bill by $50 if I set the thermostat 5 degrees lower between 8 am and 5 pm Monday to Friday.
Business Model Maturity Index method
The Business Model Maturity Index method progresses from (1) identifying a desired outcome, (2) developing a series of use cases to achieve that desired outcome, and (3) using expert judgment to estimate the relative contribution, and value, of data to each use case. The last step is to estimate the return on investment for data.
(1) Identify a desired outcome and estimate its potential impact
Clearly articulate a desired outcome that can be quantified in terms of time savings, cost savings, water savings, lives saved, etc. The estimate does not have to be precise and can rely on expert judgment.
(2) Develop use cases and estimate cost and impact
Use cases refer to decisions and strategies that can achieve the desired outcome. For each use case estimate the implementation cost and the potential impact. The value of the decisions should be accounted for over the full life-time of the project.
(3) Estimate the value of data to each use case
Consider all the data needed for each use case and the relative importance of those data to achieve the desired outcome. For each use case, assign a value from 0 (no value) to 1 (critical value) denoting the relative contribution of each piece of data. Sum the relative contribution of the data in each use case. The value of the data for each use case is estimated as: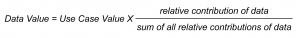
(4) Estimate the return on investment for data by use case
The return on investment (ROI) for each use case is the benefit divided by the costs (estimated or real) to implement the solution. The ROI for the data within and across use cases is the value of the data divided by the cost of data collection.
Example application
IoW Alfalfa grows alfalfa and is exploring ways to save money while maintaining productivity. Specifically, they are attempting to reduce energy costs by 10 percent.
(1) Identify a desired outcome and estimate its potential impact
IoW Alfalfa’s desired outcome is to reduce energy costs by 10 percent. Energy costs have increased as groundwater levels have declined. Currently, it costs IoW Alfalfa $0.21 to pump each AF of water one foot in elevation. IoW Alfalfa spends $2.52M annually to pump 60,000 AF from a depth of 200 ft. If they reduce energy costs by 10%, IoW Alfalfa could save $252,000 annually.
(2) Develop use cases and estimate cost and imp
IoW Alfalfa developed several use cases to help them achieve a 10% energy reduction (Figure 2).
- Groundwater Recharge – data can inform how much, when, and for how long fallowed fields should be flooded to maximize groundwater recharge.
- Irrigation Efficiency – data can inform the impact of different irrigation technologies and strategies to reduce the amount of water needed for irrigation.
- Alternative Water Sources – data can inform whether there are cheaper, alternative water sources.
- Alternative Energy Sources – data can inform the energy potential of solar panels, wind turbines, natural gas, or other alternative energy sources to supplement electricity.
- Crop rotation – data can inform the impact of growing alternative, less water intensive crops.
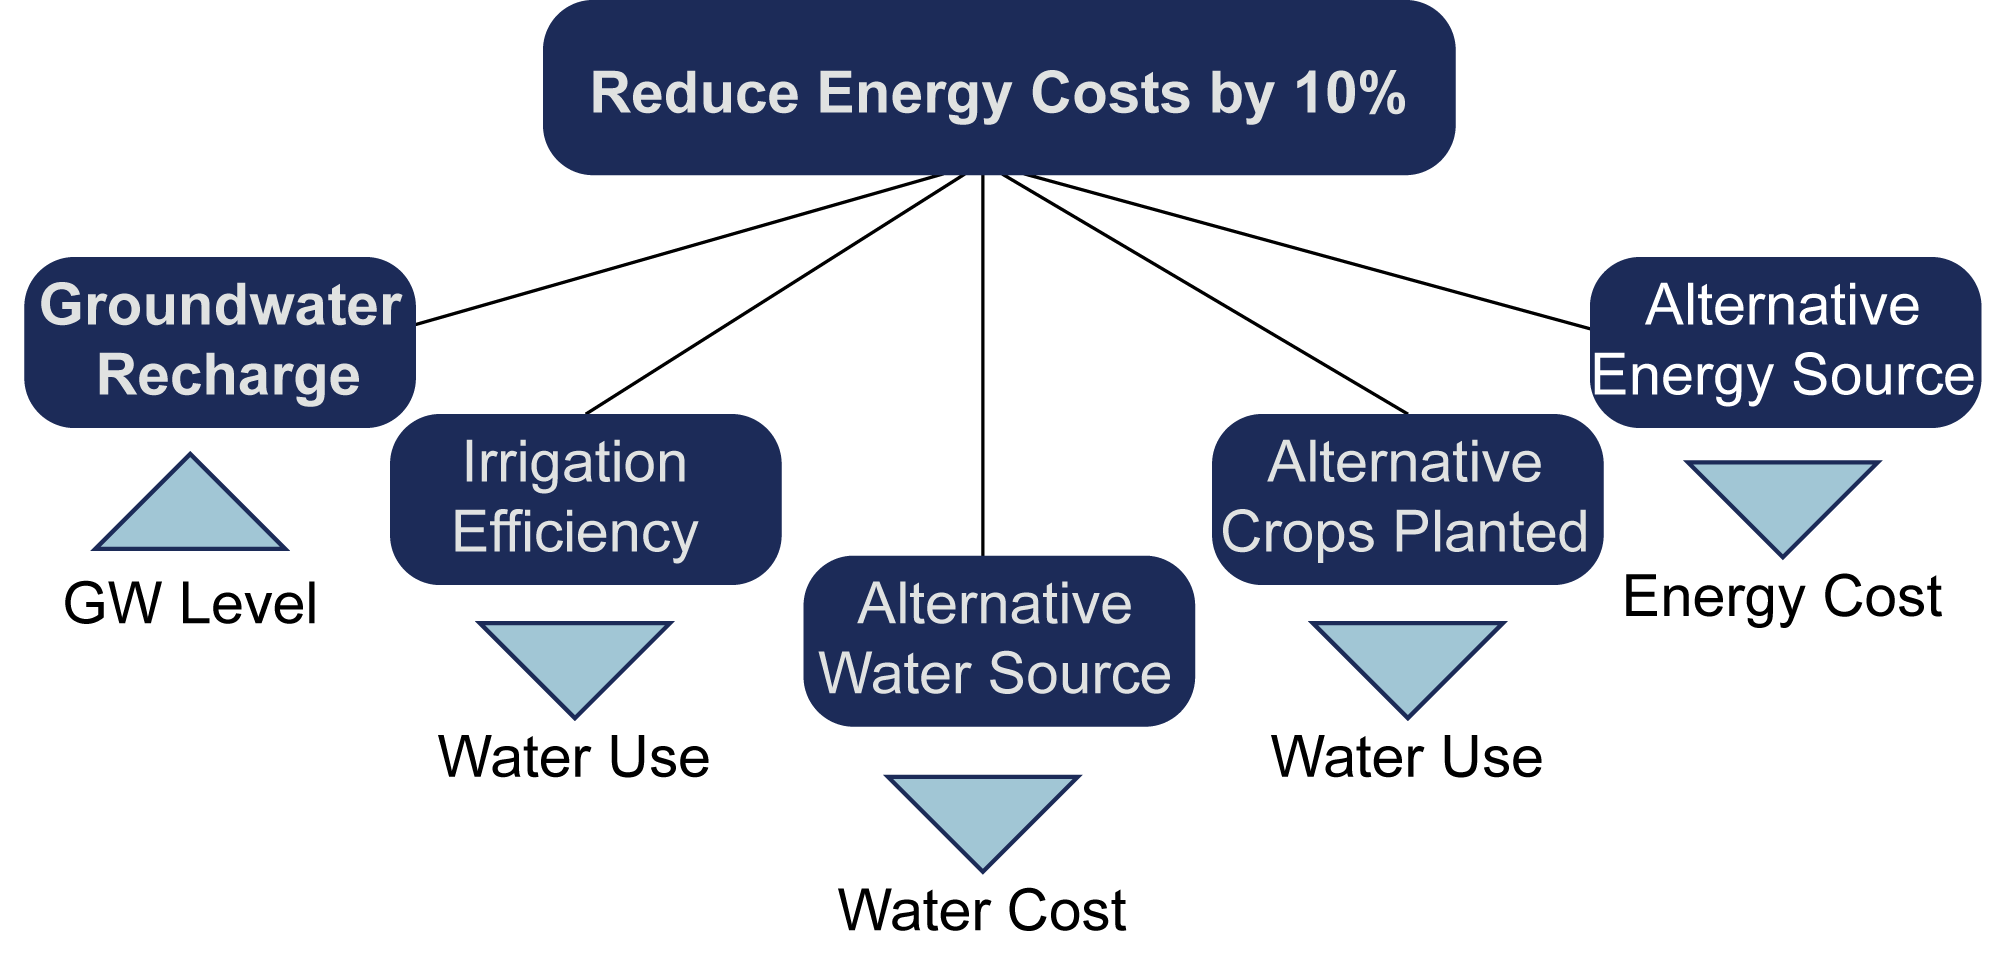
Figure 2: Use cases to help IoW Alfalfa reduce energy costs by 10%.
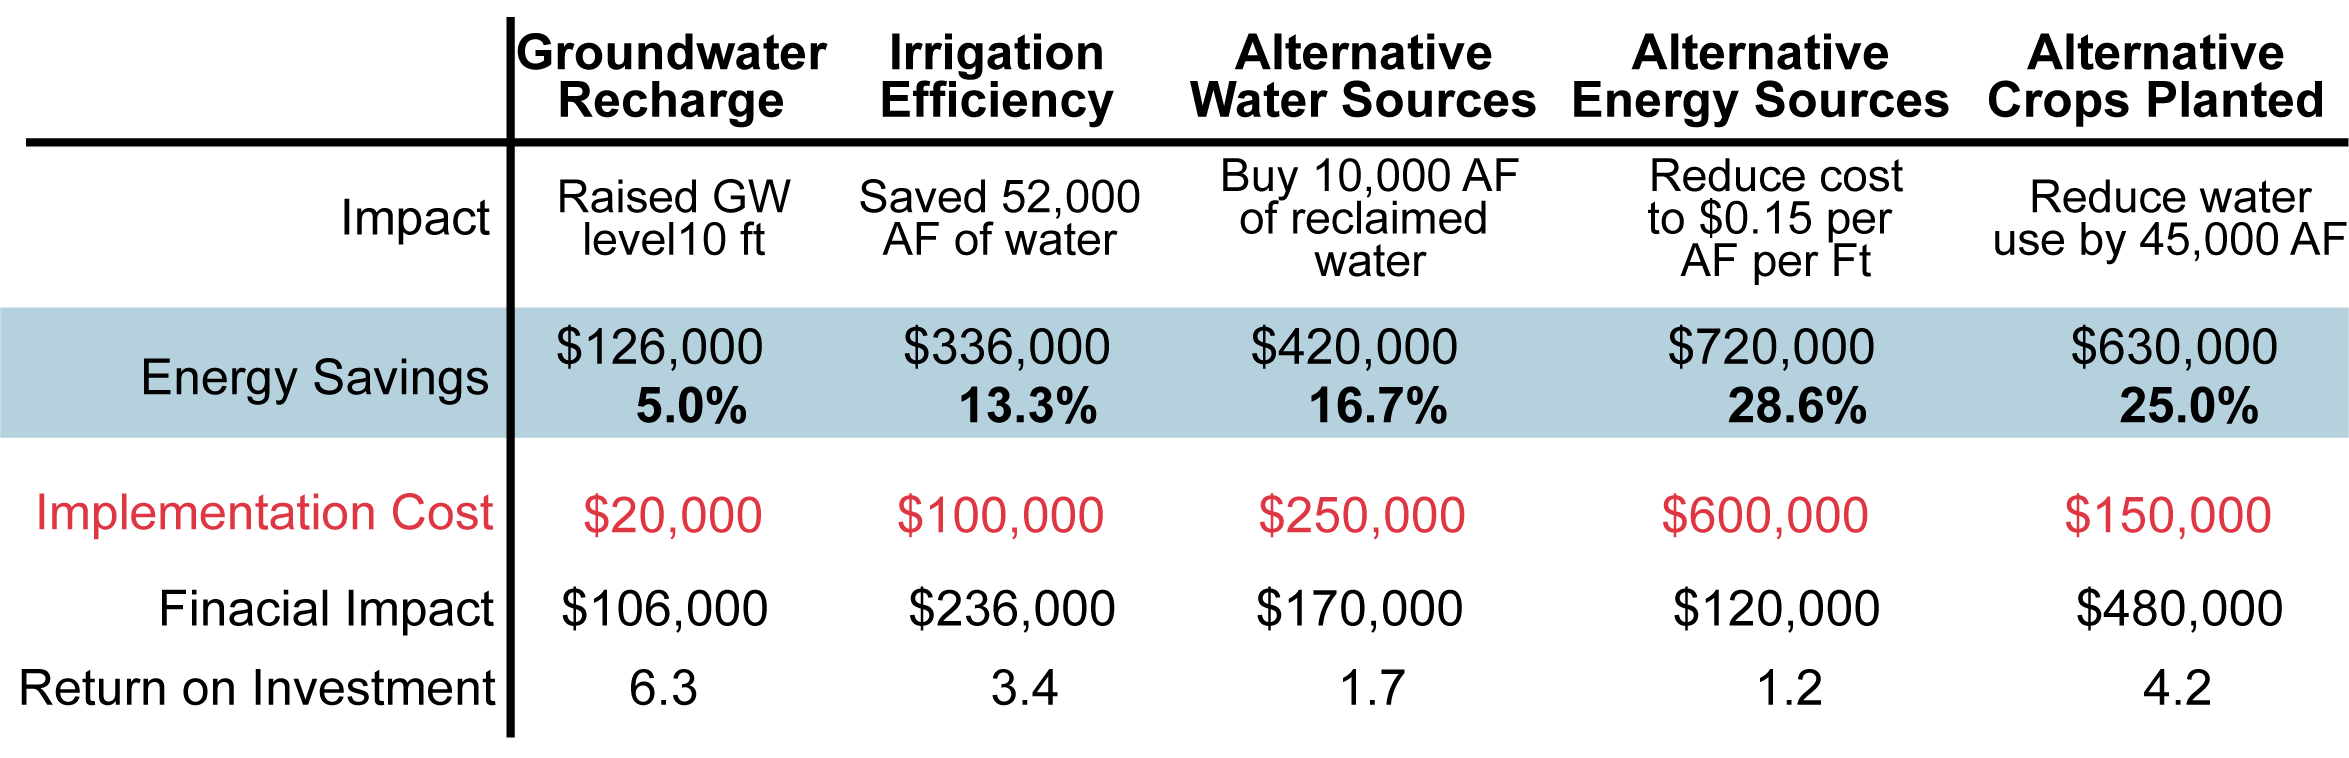
IoW Alfalfa’s next step is to document each use case’s ability to meet the 10% energy reduction goal, as well as any implementation risks. For example, groundwater recharge costs $20,000 to implement and is estimated to raise groundwater levels by 10 feet the first year (Figure 3). This would reduce pumping costs by 5%, providing a return on investment (ROI) of 6.3, and is feasible to implement. The other options are more expensive and difficult to implement with a lower ROI, but they may produce energy savings of 13.3 to 28.6%. IoW Alfalfa may choose to implement one or a combination of these use cases.
Table 1: Estimated costs and savings for each use case. Potential energy savings range from 5 to 29%.
(3) Estimate the value of data to each use case
Next IoW Alfalfa wants to figure out the data it needs to inform decision-making for each use case. The company identified nine types of data tied to different decisions:
- Crop type: What crops are on the field? What other crops are an option?
- Crop water use: How much water does each crop use? What crops are flood resistant?
- Groundwater levels: What are current groundwater levels? What is the trend? How does it respond to on-farm flooding?
- Energy prices: What is the cost for other energy options (hydropower, solar, wind)?
- Soil moisture: What is the soil moisture? How does that vary by soil type and crop water use?
- Streamflow: What are surface water and groundwater interactions? Is surface water available to supplement?
- Water rights: Are there available surface water rights? Groundwater rights?
- Wastewater utilities: Are there wastewater or reclaimed water options?
- Weather data: When and how much does it rain? What is the evapotranspiration?
Expert judgment is used to assign the relative importance of each dataset for decision-making (Table 2).
Table 2: Relative contribution of data for decisions in each use case. Empty circles mean no value (0), full circles mean critical (1).
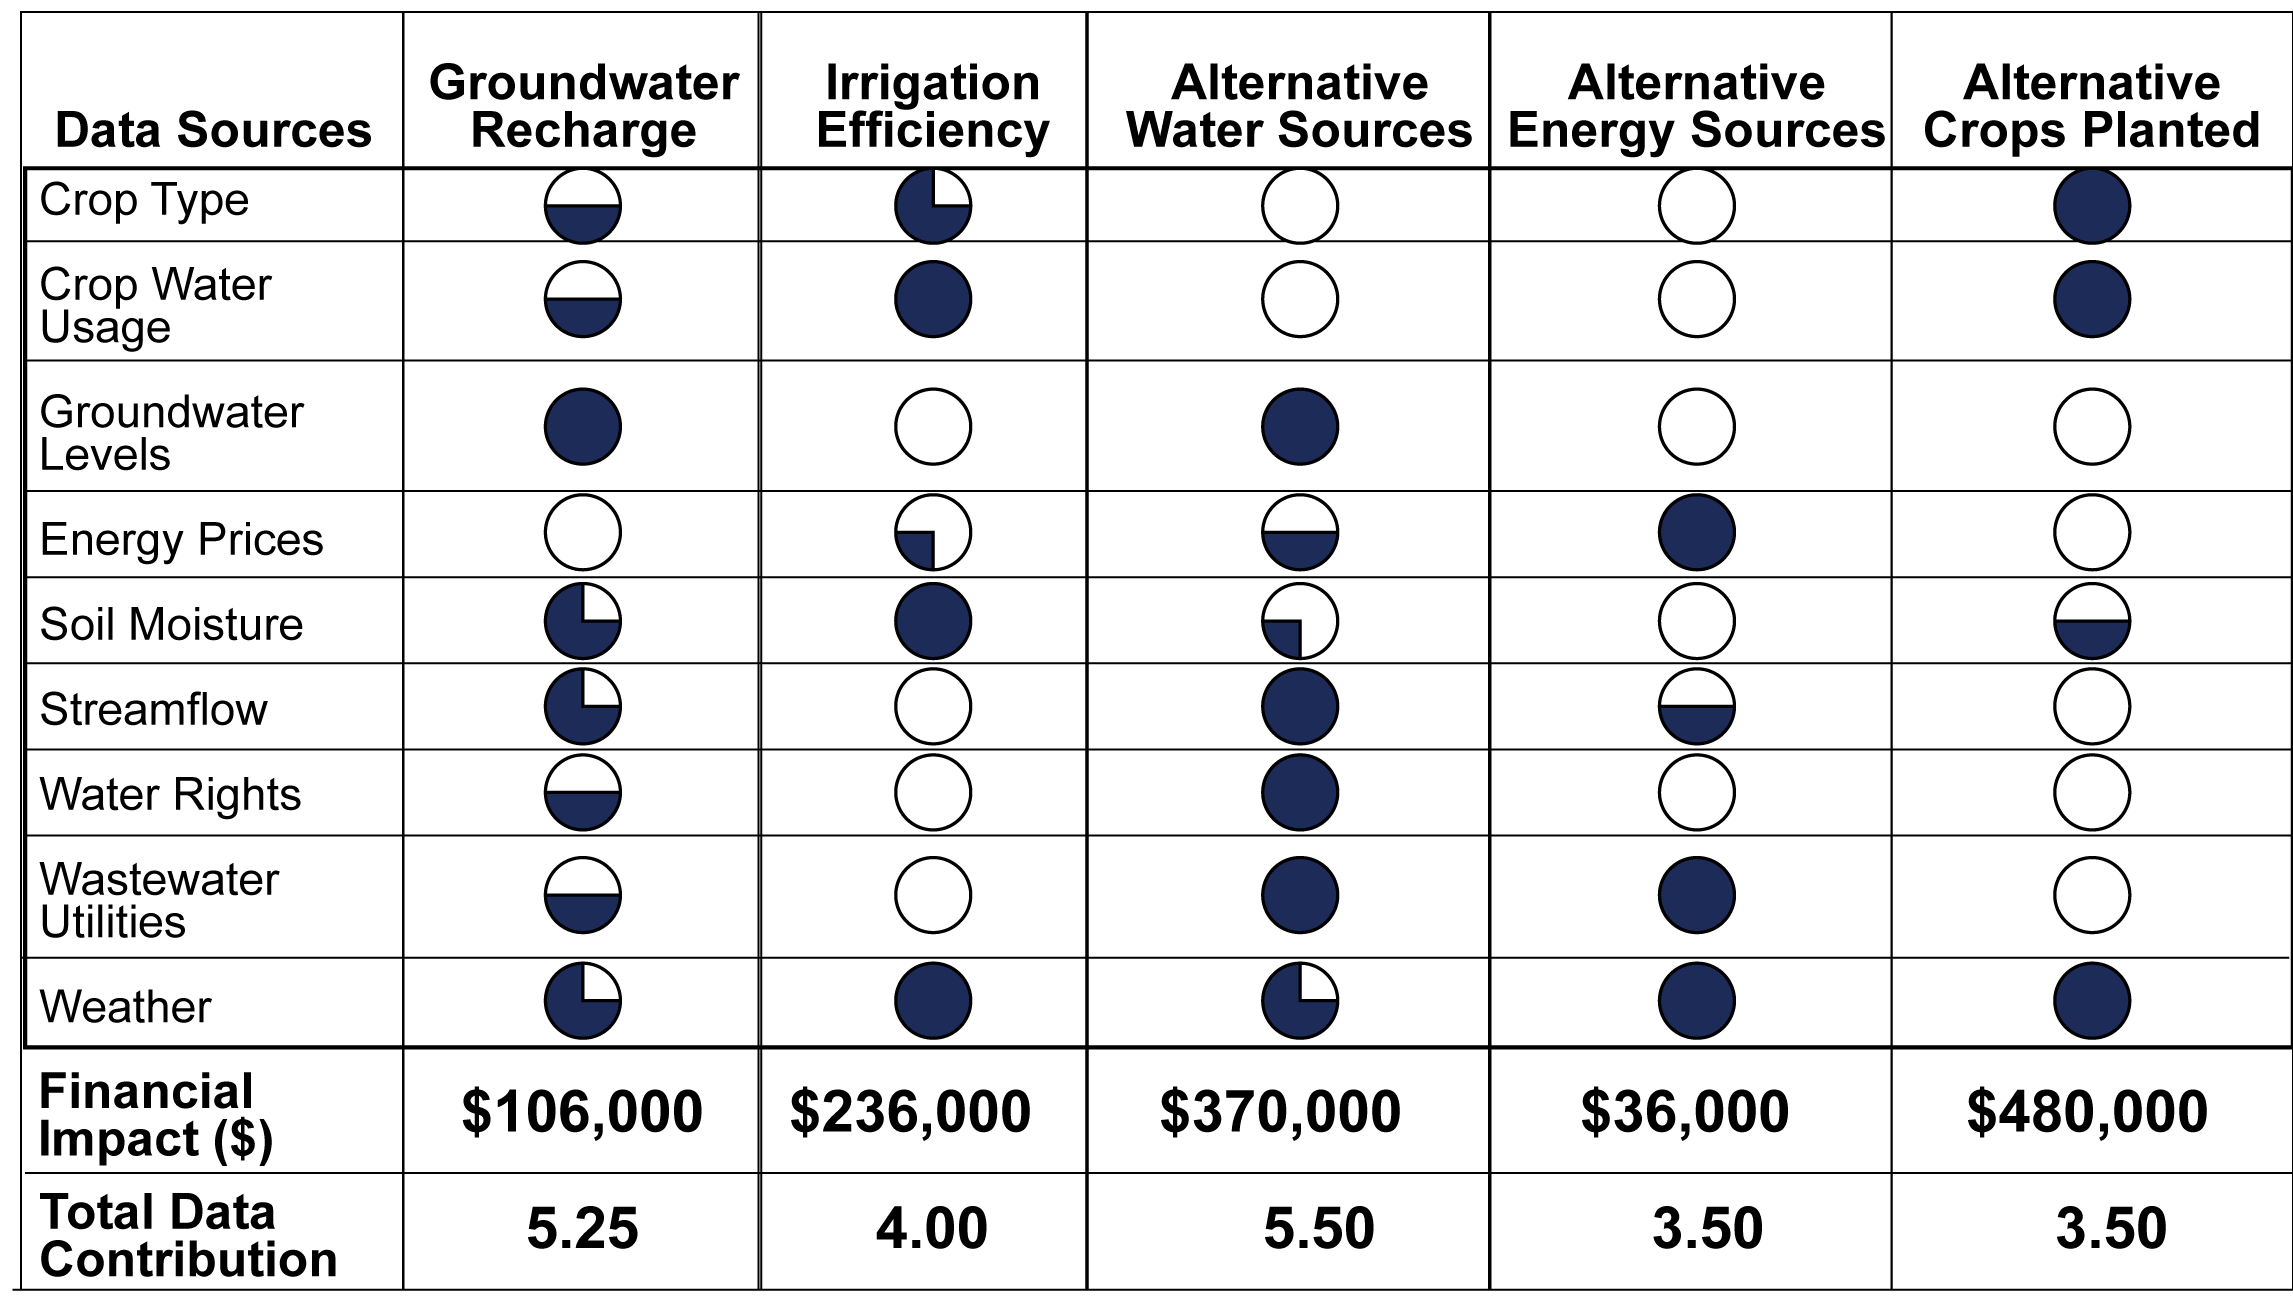
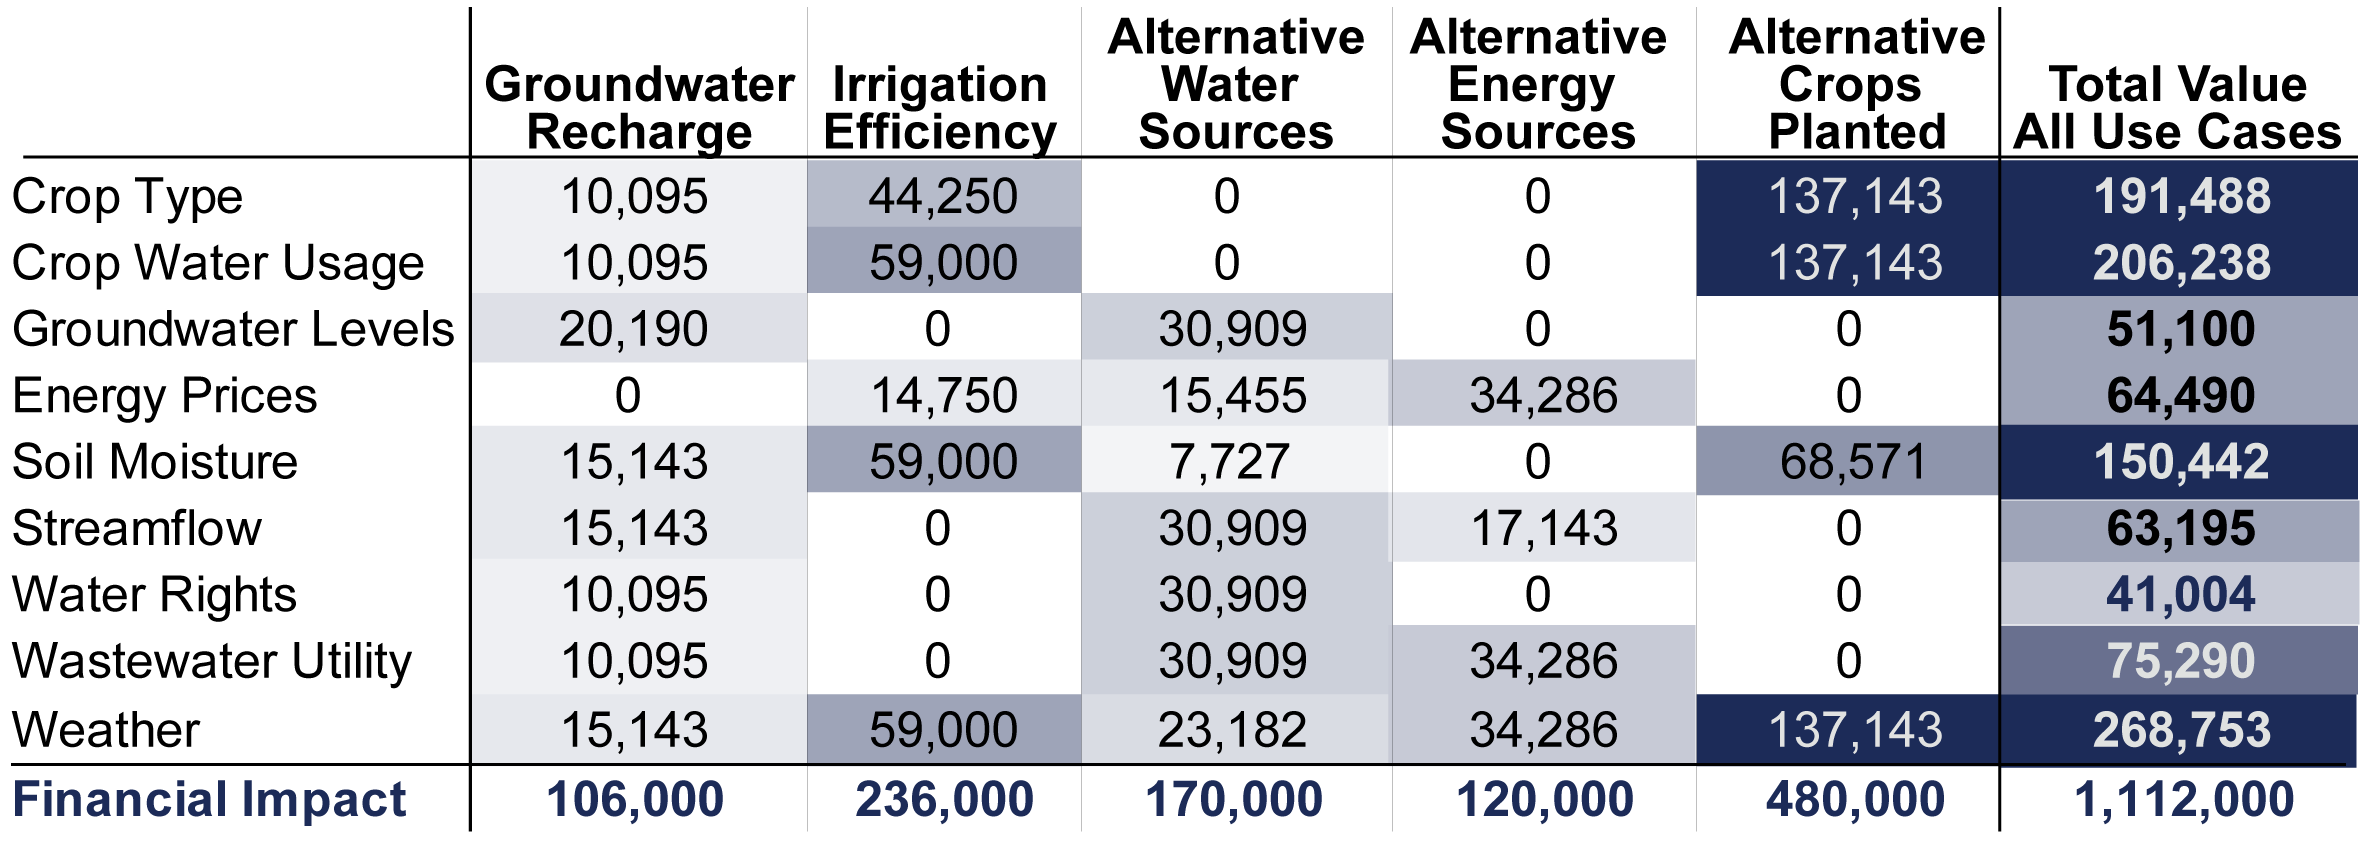
The value of the data is then distributed as a fraction of the financial impact. For instance, the value of crop water use data for groundwater recharge is: $106,000*0.5/5.25 = $10,095. Weather data were needed for each use case and had the highest value across all use cases (Table 3).
Table 3: Estimated data value by use case.
(4) Estimate the return on investment for data by use case
Here, we only look at IoW Alfalfa’s return on investment from weather data for these use cases.
- They obtained 95% of their weather data for free through public agencies. It took their analyst 80 hours to obtain and clean the data at $80/hr.
- The other 5% of data were collected from 3 sensors in their fields that cost an initial $10,000 to set up and $800 in annual maintenance and operation. The sensor data costs $34,000 in year one and $4,000 in subsequent year. Another $10,000 is spent by the analyst to process and integrate the sensor data with public data
- The total cost for weather data ranged from $44,000 (Year 1) to $14,000 (following years).
The return on investment for weather data ranges from 0.34 to 1.08 (year 1 to following years) for the groundwater recharge use case and 3.12 to 9.80 (year 1 to following years) for the alternative crops planted. The total return on investment for weather data if all use cases are implemented ranges from 6.11 in Year 1 to 19.2 in following years (Figure 3).
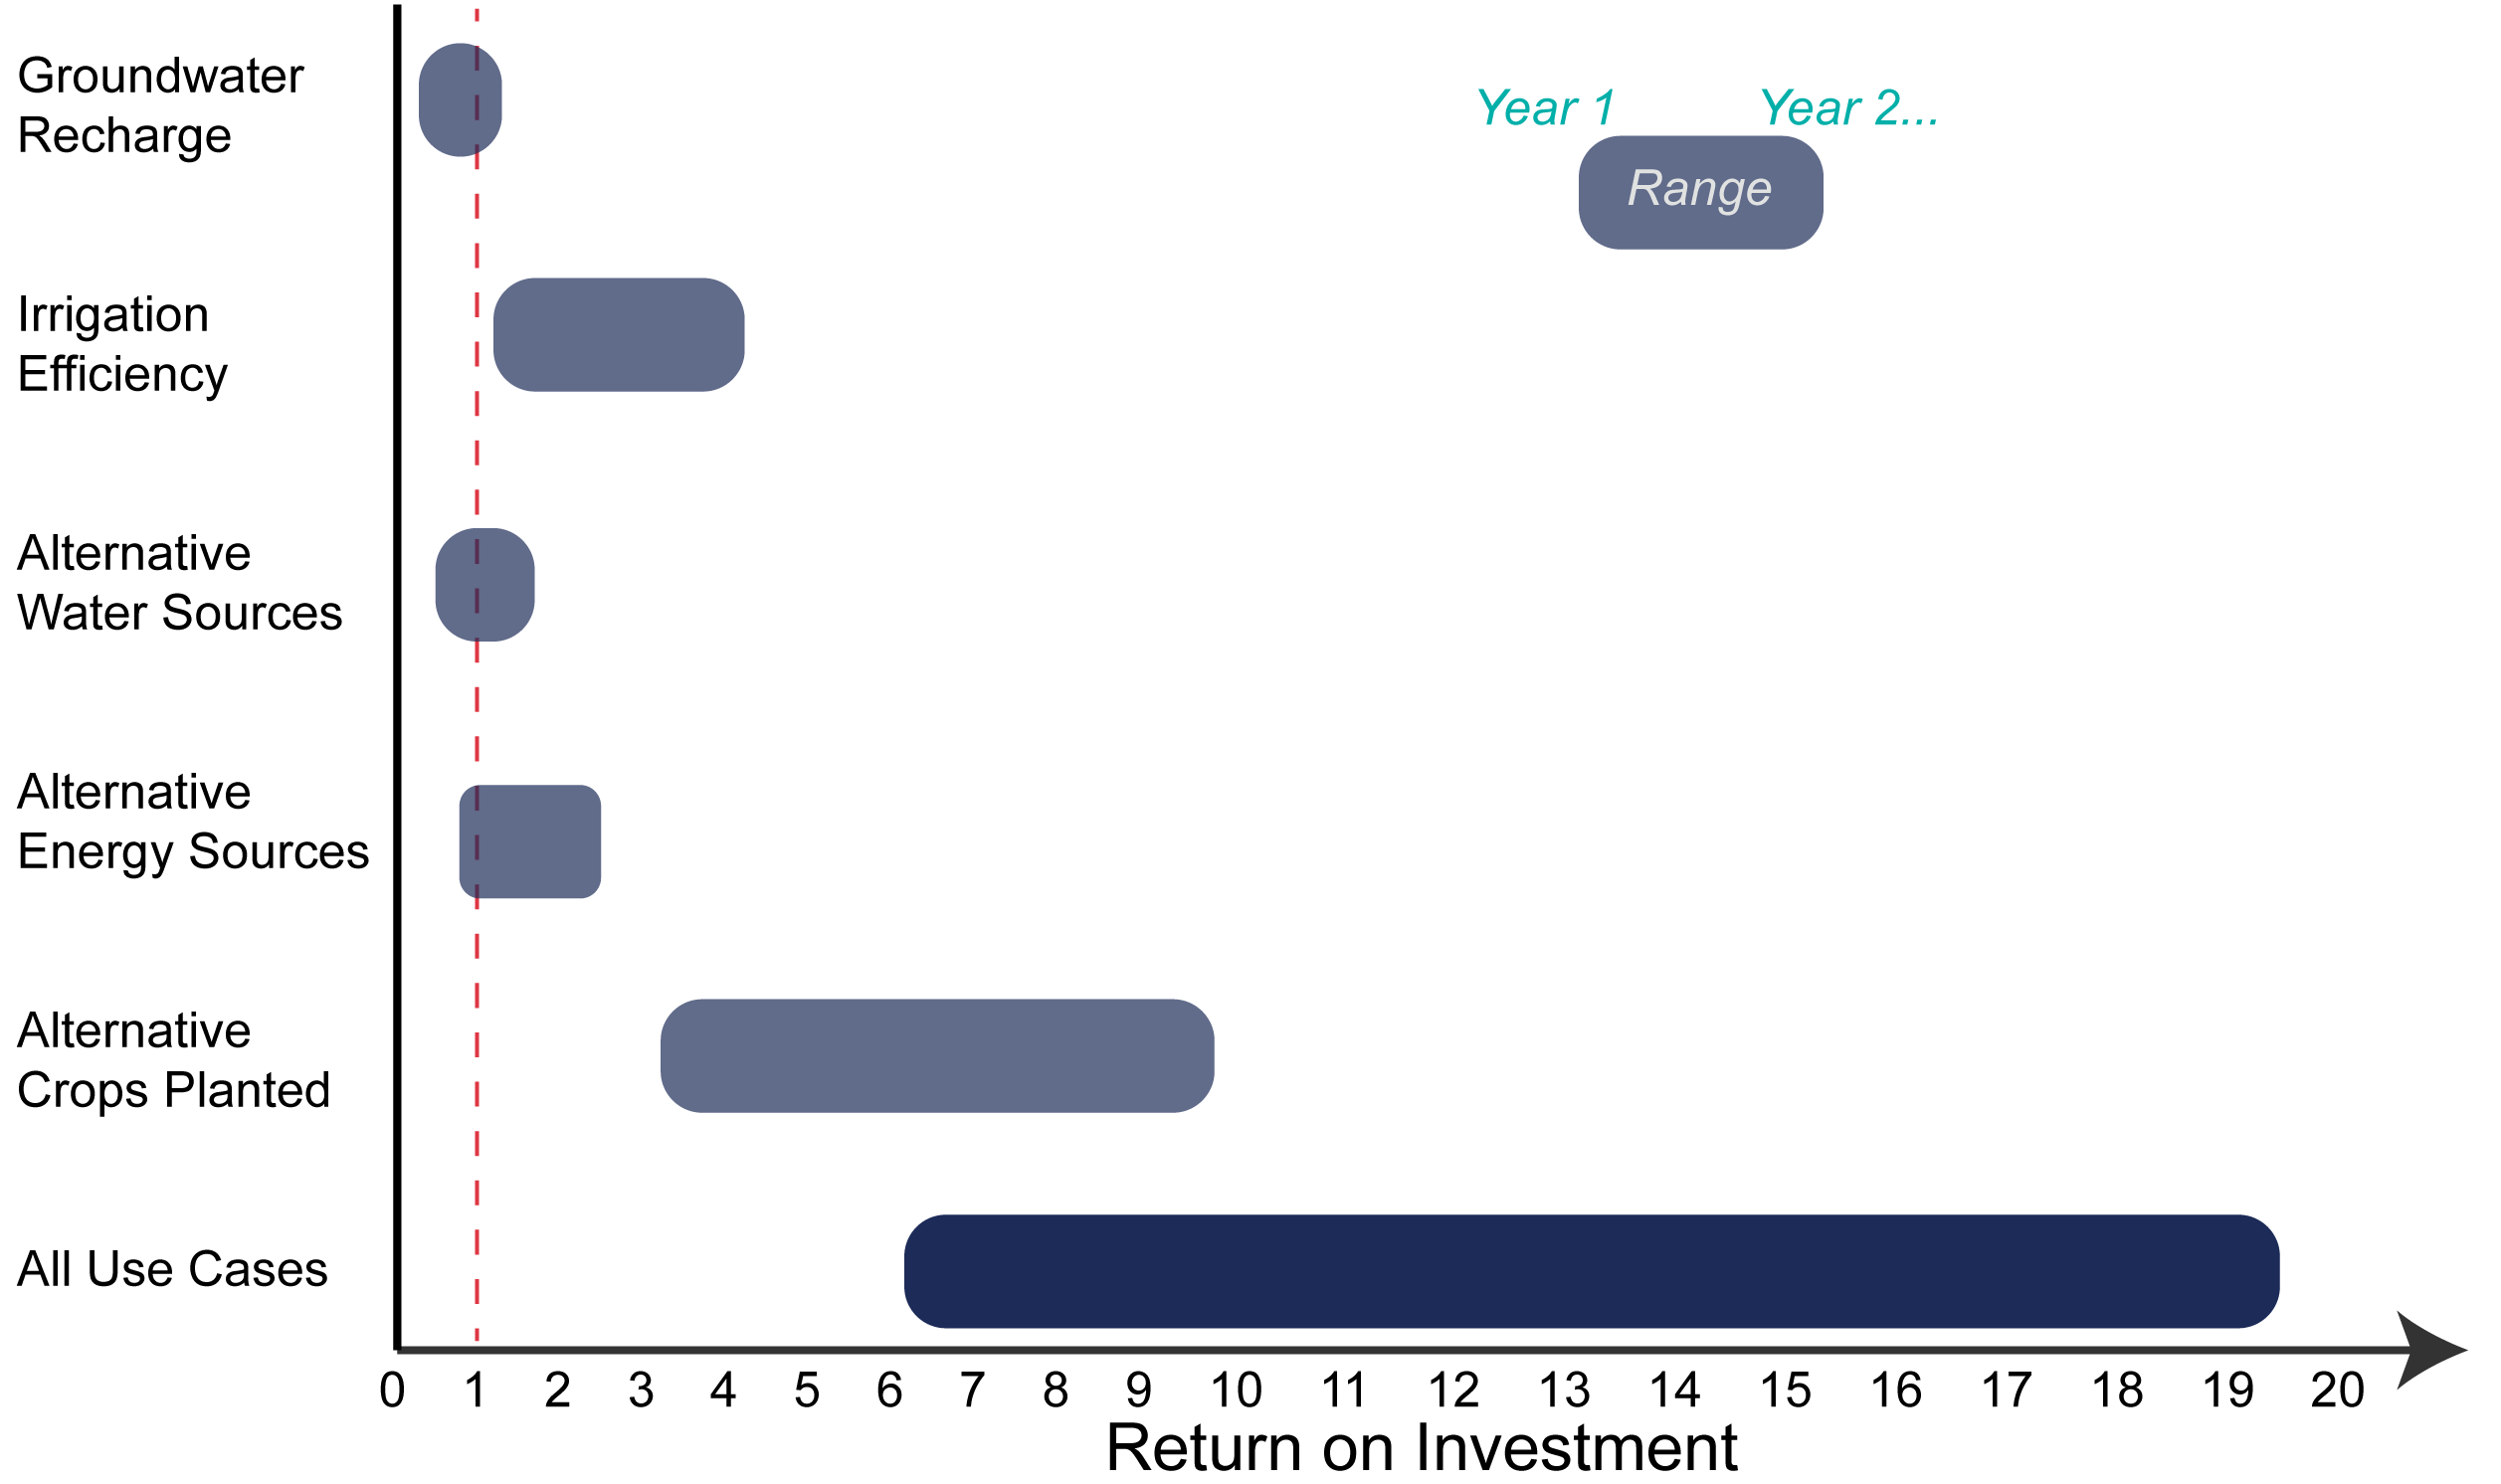
Figure 3: The return on investment for weather data by use case in Year 1 and following years. ROI<1 means data value is less than the costs to collect. ROI>1 means data are more valuable than their cost.
Final thoughts
The Business Model Maturity Index method assumes no decision will be made without data. However, the value of the data should be linked to improvements from the original decision. For instance, IoW Alfalfa already floods its fields in March to recharge groundwater. However, the data show flooding can be extended till the 3rd week of April without hurting productivity. The value of the data is the change in groundwater depth and subsequent energy savings that come from extending the length of time the fields are flooded. IoW Alfalfa attributed 25% of the groundwater increase to those extra three weeks of flooding, resulting in an ROI for weather data informing groundwater recharge of 0.09 in Year 1 and 0.27 in following years (original ROI * 0.25).
For more information:
- Cantor, A. et al. 2018. Data for Water Decision Making: Informing the Implementation of California’s Open and Transparent Water Data Act through Research and Engagement.
- Macauley, M.K. 2005. The Value of Information: A Background Paper on Measuring the Contribution of Space-Derived Earth Science Data to National Resource Management.
- Moody and Walsh. 1999. Measuring the Value of Information: An Asset Valuation Approach. European Conference on Information Systems.
- Smarzo, Bill. 2017. Determining the Economic Value of Your Data. Strata+Hadoop Make Data Work Conference.