Evapotranspiration data saves water and increases crop yield
By Lauren Patterson
Method – Direct Survey
Categories – water quantity, water use, government, agriculture

istock.com/nd300
The California Irrigation Management Information System (CIMIS) provides raw weather data, as well as information on evaporation rates and crop water usage, to inform irrigation decisions. A series of surveys demonstrated CIMIS was used to save water and increase crop productivity. The benefit-to-cost ratio of CIMIS to irrigation users was between $56 and $76 for every $1 spent.
Organization: data producer and data hub
The California Department of Water Resources (DWR) and the University of California, Davis (UC Davis) created the California Irrigation Management Information System (CIMIS) in 1982 to provide weather and evapotranspiration (ET) data to irrigators. CIMIS was the only public source of ET data in California and its purpose is to encourage the application of weather-based, water budgeting methods for irrigation. DWR took full ownership of the program in 1985 and today CIMIS continues to operate more than 145 automated weather stations.
Primary data purpose: Operational and decision-making
The primary purpose of CIMIS is to help growers make operational decisions for irrigation. Secondary uses of the data not foreseen by DWR when they created CIMIS include broad decision-making (such as integrated pest management) and research / innovation (such as estimating road friction in automobile accidents).
CIMIS weather data for irrigation
CIMIS collects weather data that are transformed into information that supports day-to-day irrigation operations (Figure 1). Prior to CIMIS, many irrigators relied on a variety of methods, with differing levels of accuracy, to estimate plant health and water use. Data from CIMIS stations (14 parameters) are collected and sent to DWR, where the data are quality controlled and converted into information (soil evaporation and water use) that inform how much water needs to be applied to different crop types. Both the data and information are disseminated to users. The data were originally made available via newspapers, radio, television, internet, fax, and telephone. Today, many users opt to receive daily emails for their stations of interest. Starting in December 2012, users can also access the data through web services.
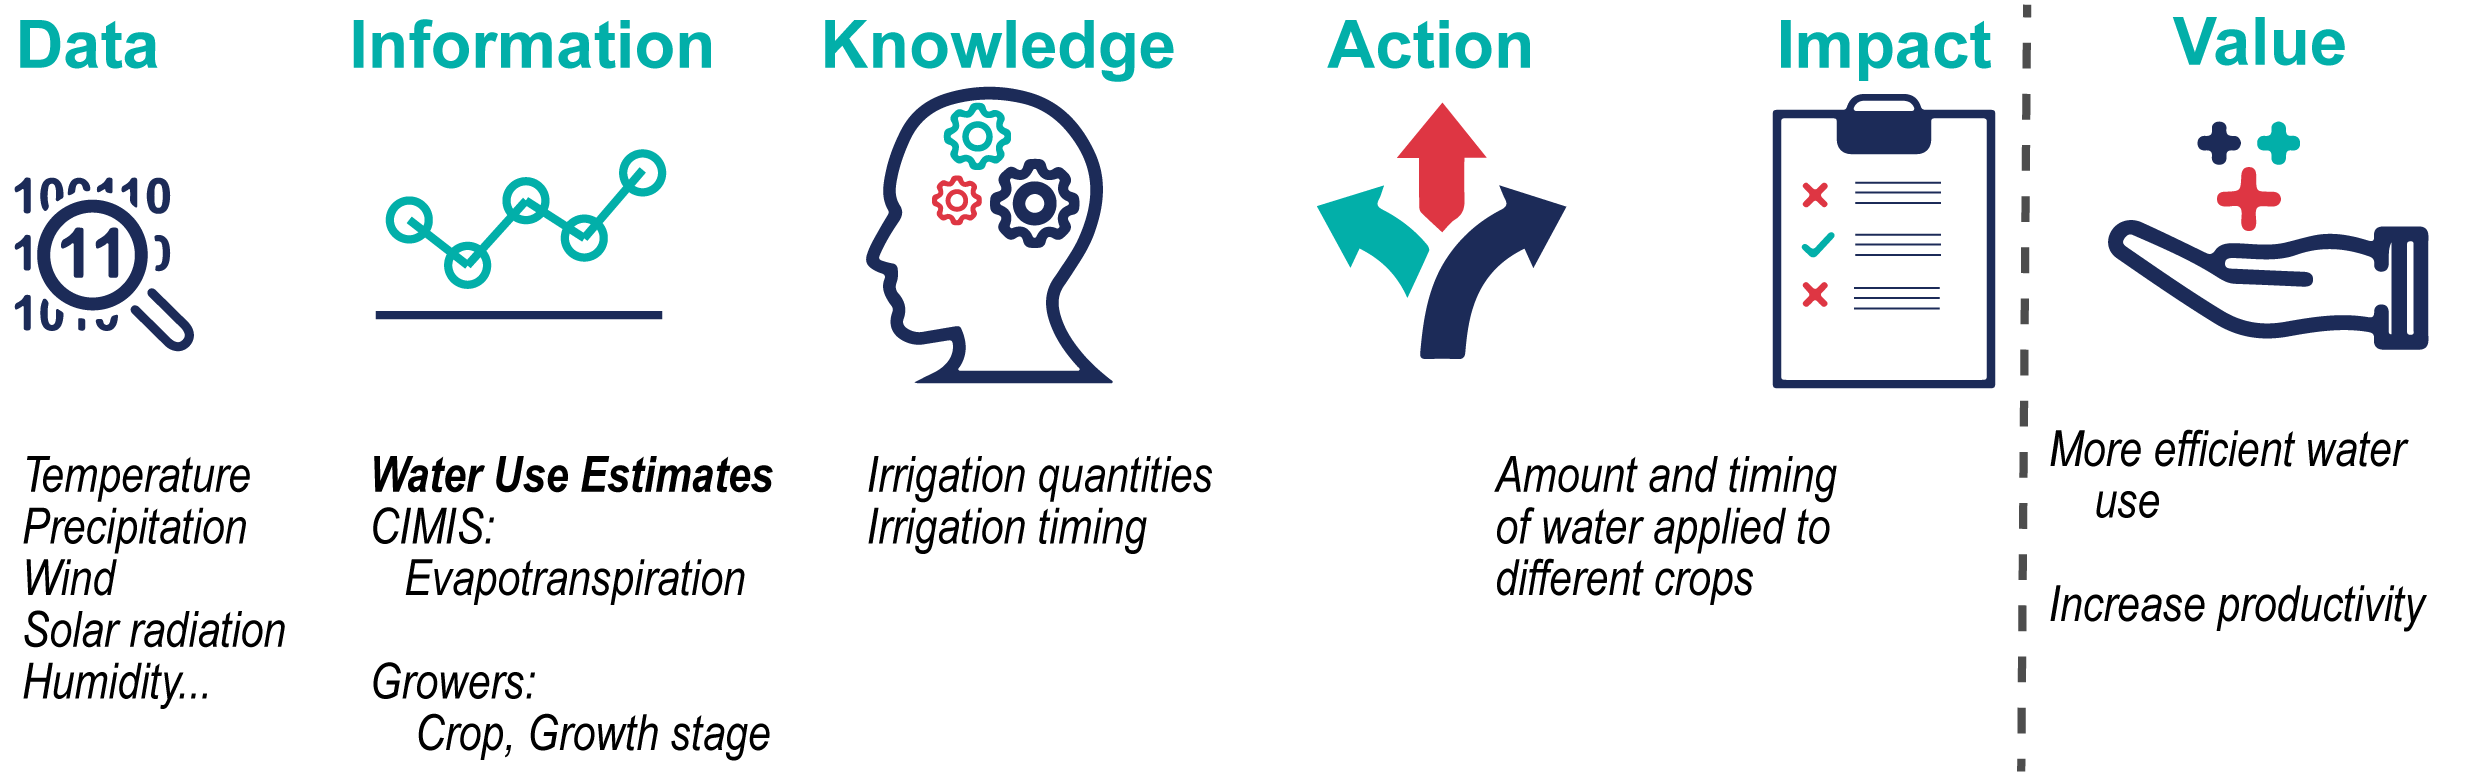
Figure 1: CIMIS transforms data into information used by growers to make operational decisions.
The number of active CIMIS stations grew from ~30 stations in the late 1980s, to ~90 stations in 1998[1], to over 145 automated stations by 2015.[2]. The number of registered CIMIS data users grew from 2,000 in 1998 to more than 40,000 by 2015 (Figure 2). You do not have to register to use CIMIS data, but registered users can create a profile to receive data from selected stations via daily email. CIMIS uses registration to help track data usage and accessibility. Some registered users act as data hubs that provide CIMIS data to their own users, creating a disseminating network with multiple access points (Figure 2). Some private companies have even profited by refining and selling customized CIMIS data as tailored information to customers. The size of the market for private companies expanded with the standardization of ET data statewide.
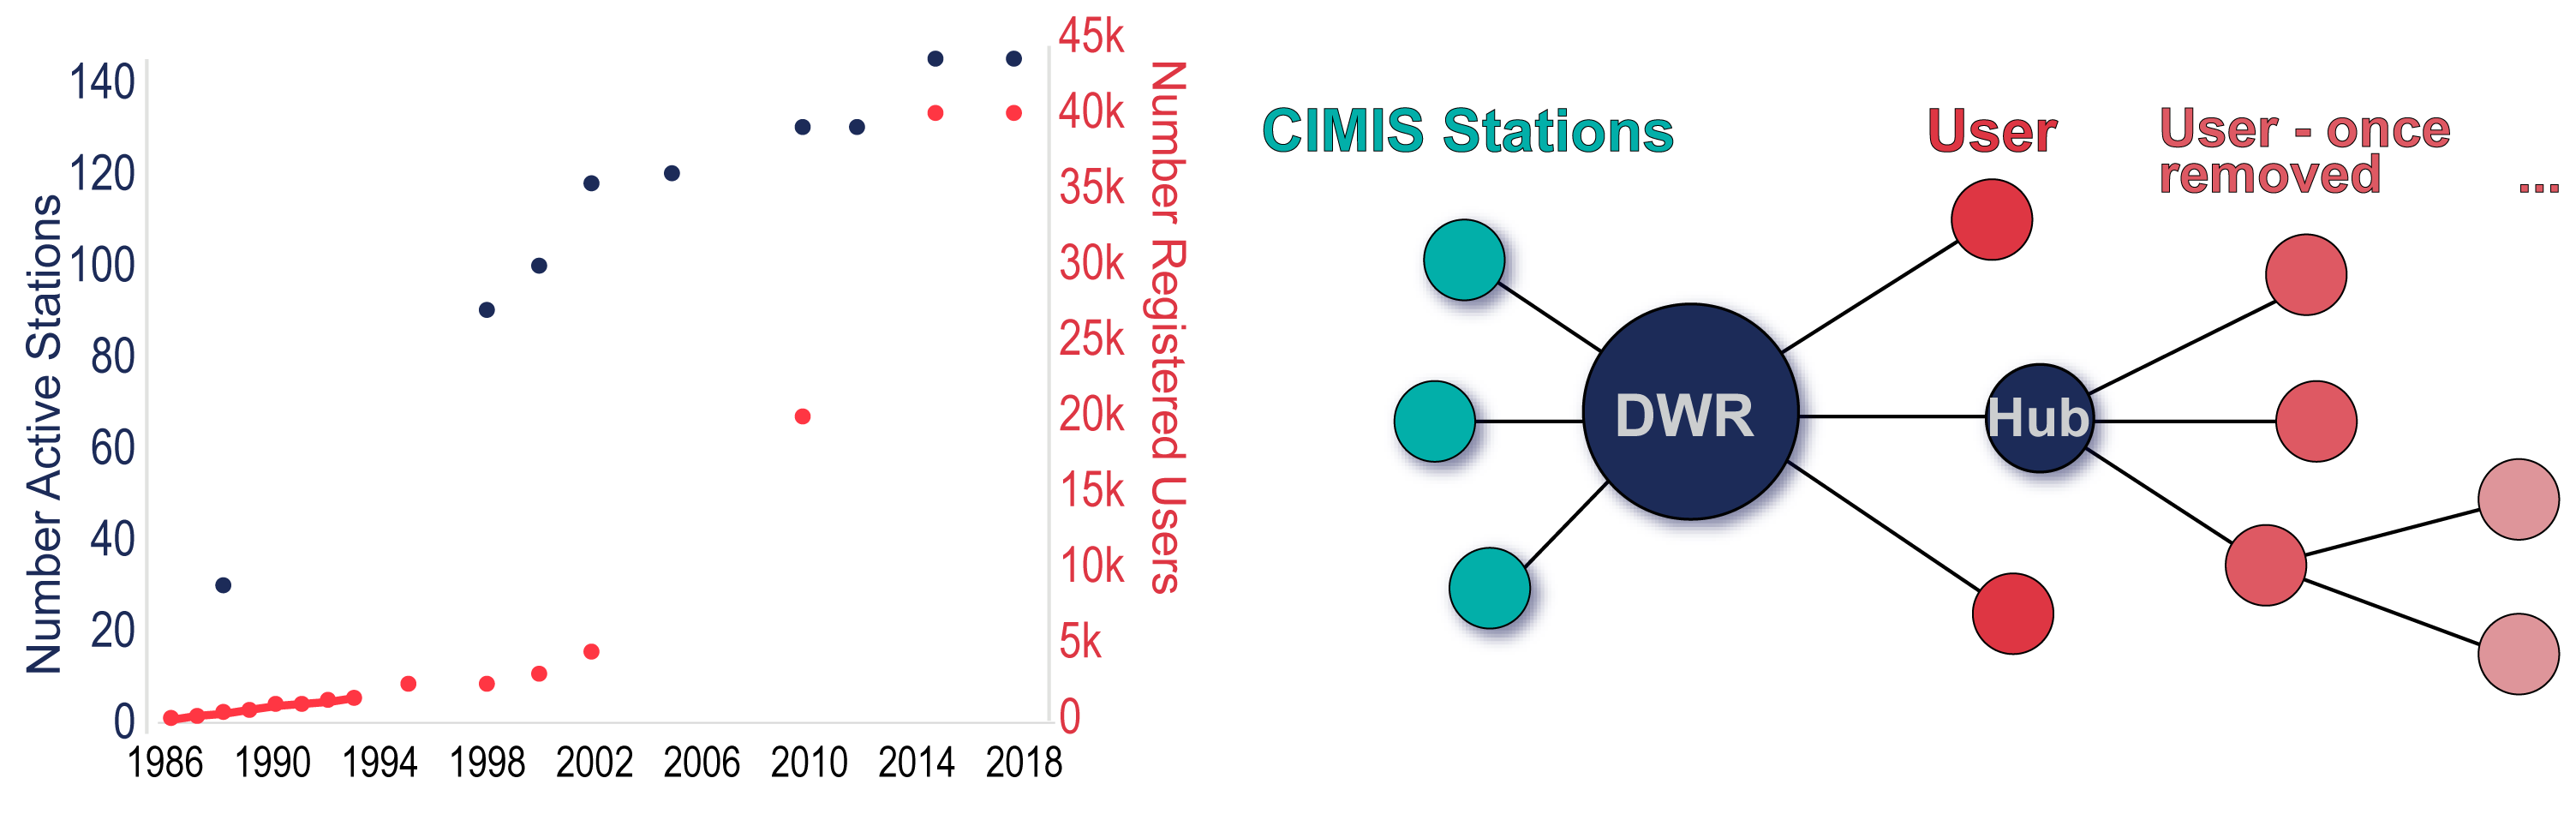
Figure 2: (Left) The number of stations grew rapidly during a 7 year drought in the late 80’s, while the number of registered users grew after CIMIS was modernized in the early 2000’s. (Right) DWR collects and shares data from CIMIS stations with users, who may in turn share CIMIS data to their users.
Estimating value
The value of CIMIS was much discussed between 1996 and 2000 as DWR was being asked to justify government spending and the provision of free data. A direct survey of registered users and UC Cooperative Extension advisors was conducted to understand how both registered and non-registered users benefitted from CIMIS.[3] The UC Cooperative Extension advisors were asked to estimate how widely CIMIS was used in order to estimate statewide benefits to both registered and non-registered users.
Six use cases emerged from the direct survey, along with a variety of other uses:[4]
- Irrigation scheduling (64%)
- Research (32%)
- Other (16%)
- Resource Management – water, air, land use (15%)
- Pest Management (14%)
- Frost Control (6%)
- Fire Protection (2%)
- Soil Conservation (2%)
The primary purpose of CIMIS, irrigation scheduling, was translated into economic value with regards to increased crop productivity and reduced water use.
Costs
In 1998, the approximate up-front cost for a new CIMIS station was $5,000 with an estimated $200 spent annually on maintenance and operation.[1] Many of the stations were owned or maintained by local organizations, particularly water and conservation districts.[5] Some growers cost-shared CIMIS stations in order to have a station providing data near their fields. The annual cost to DWR in 2000 was $850,000 and included stations owned by DWR (less than half of all stations), software development, and technical support.[4] Assuming growers covered the costs for sixty stations, the full cost were estimated as $1.16M annually.
Value for irrigation
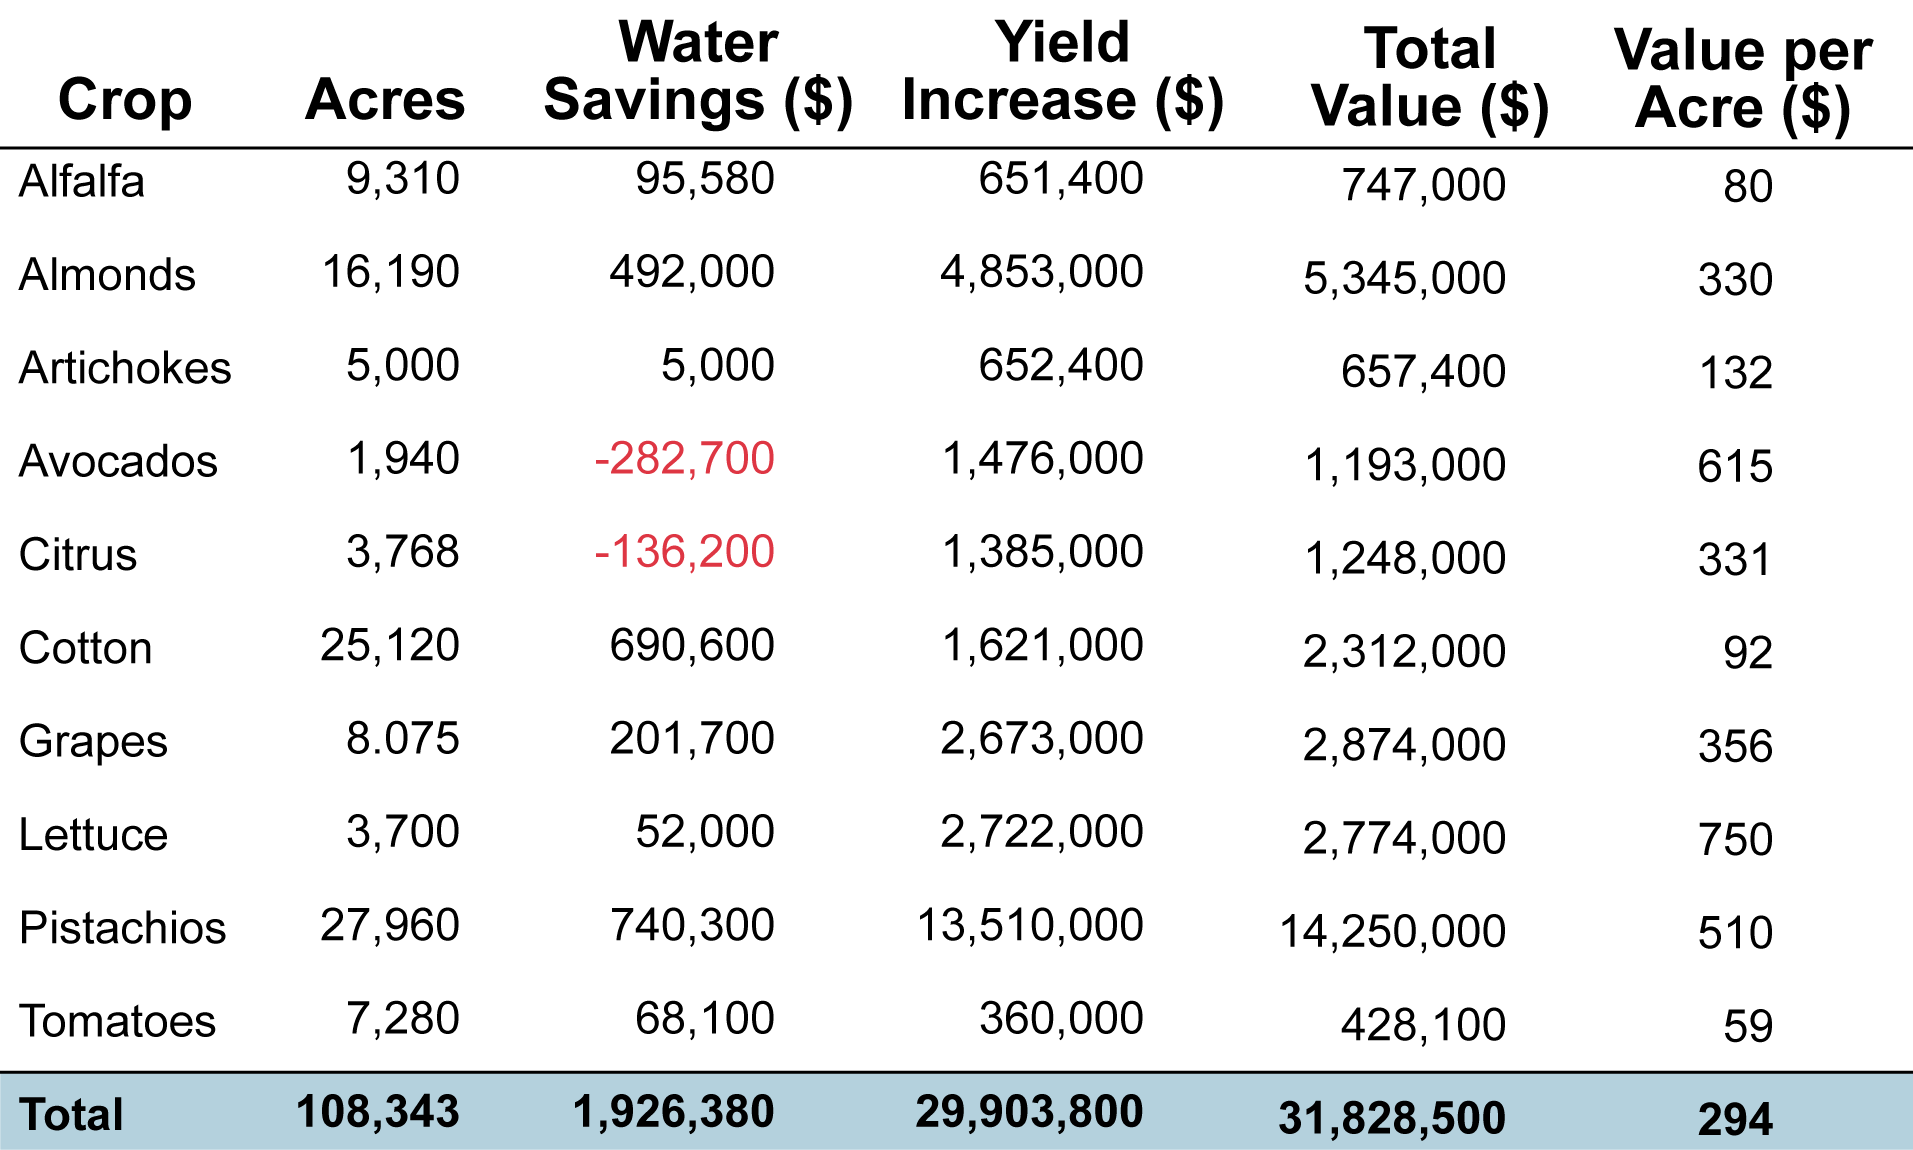
These studies found CIMIS reduced statewide water use by 13% (107,300 AF) and increased crop yield by 8% ($64.7M).[4][5] Benefits varied by farm (crop type), market characteristics, and weather conditions. These savings did not accrue evenly among users. For instance, almonds, cotton, grapes, and pistachios saved more than $20 per acre by decreasing water use (Table 1). In contrast, avocados and citrus spent $145 and $36 more on water, respectively, because CIMIS revealed farmers were not using enough water. While water savings differed, yield increased for all crops ranging from a benefit of $65 per acre for cotton to as much as $761 per acre for avocados (the increased water use resulted in a higher crop yield). Urban areas, such as parks, cemeteries, and golf courses were also able to reduce water use by 5,800 AF per year, saving $2.35M.
Table 1: CIMIS resulted in water savings and increased yield as shown for the top ten crops in California.[1]
Other benefits
The direct survey revealed secondary uses of data from CIMIS by many organizations with diverse impacts (economic value not estimated).[1][4]
- Pest control. Eighty percent of pest control agencies used CIMIS data. Two agencies reported reducing pesticide use by up to 40 percent.
- Municipal water districts. Three water districts reported annual savings of 10-20% through (1) irrigation management education programs showing users how to use CIMIS, (2) providing CIMIS data through an irrigation hotline, and (3) using CIMIS data to develop irrigation pricing structures.
- Legal, public health, and academic research. Private investigators used CIMIS to estimate road conditions for auto insurance companies and damages from pesticide drift. Regulators used CIMIS to monitor air quality, while academics learned how to track mosquito populations from CIMIS data.
Today, real-time CIMIS data are used by the State for integrated pest management, by growers for weather hazards, by the federal government for freeze forecasts, by firefighters during forest fires, by highways maintenance crews to identify when roads might need to be de-iced, and so on.
Final thoughts
The benefits of water savings and increased productivity from CIMIS were accrued by users, while the costs were spread between DWR and data producers (some of whom were also users). The benefit-to-cost ratio ranged from $55.6 (if considering the full cost to DWR and local partners) to $76.1 (DWR costs only) in savings for every $1 spent (Figure 3). The impact of CIMIS will likely vary year-to-year due to fluctuations in crop prices and weather conditions.
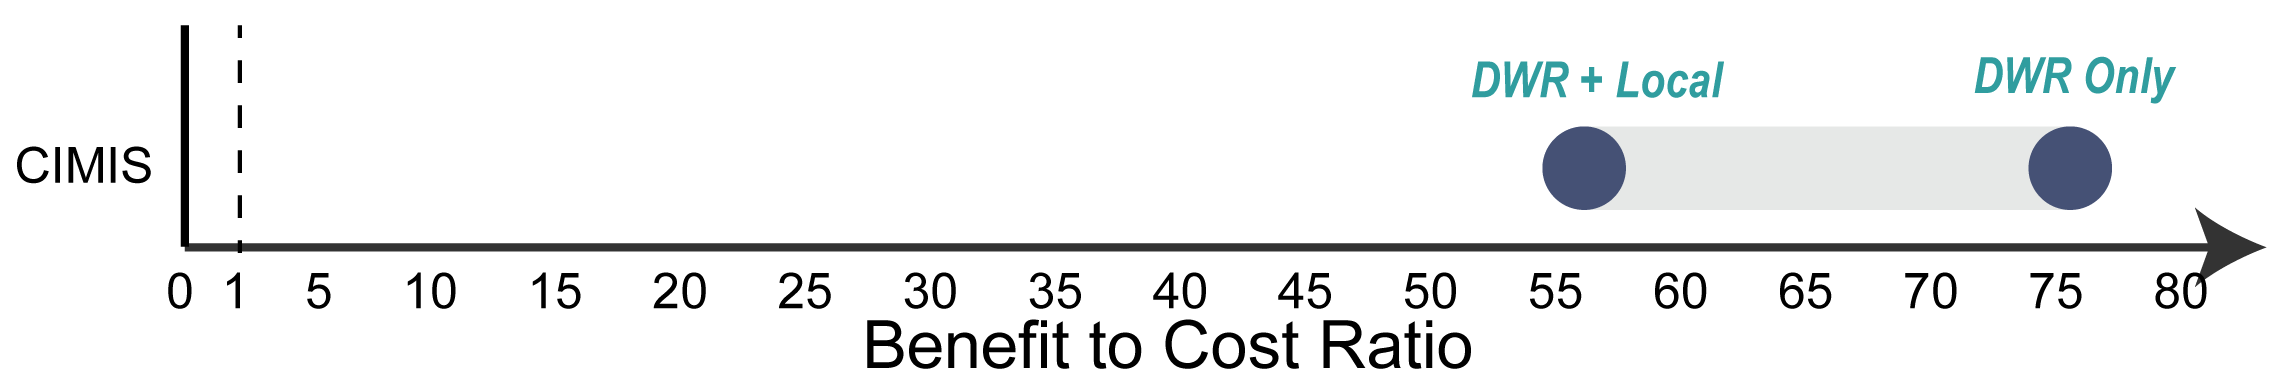
Figure 3: Benefit-to-cost ratio of CIMIS.
The benefit to data users was positive, ranging from $59 to $750 per acre depending on crop type. Did the DWR (a government data hub and producer) benefit directly? Water and energy savings may benefit state infrastructure and increase water availability for other purposes. Increased crop yield may benefit the state through sales taxes. The benefits to the state from CIMIS may also not be monetary or tracked. The mismatch between the costs of producing data and where benefits accrue remains a constant challenge for valuing public data.
For more information:
[1] Cohen-Vogel et al. 1998. The California Irrigation Management Information System (CIMIS). Intended and Unanticipated Impacts of Public Investment. Choices, pp. 20-25. [2] CIMIS [3] Parker et al. 2000. Publicly funded weather database benefits statewide users. California Agriculture 54 (3). [4] Parker & Zilberman. 1996. The Use of Information Services: The Case of CIMIS. Agribusiness 12 (3): 209-218. [5] CIMIS Agriculture Resource Book. 2000.