Market methods
Last Updated November 26, 2018
Market Methods can be used to value data by understanding the user’s willingness-to-pay. Market methods assess the value of data as revealed through markets and experiments or as stated on user surveys.
Market methods are focused on understanding the customers’ willingness-to-pay (WTP) for a product or service. The methods for assessing a user’s WTP for data vary depending on whether data are treated as physical or intangible assets. When data are in the market and treated as physical assets (i.e., end users are charged per download, service, or subscription), the WTP is revealed (revealed preferences) When data behave as intangible assets outside of a market, their value can be estimated through stated preferences, where users are surveyed to understand the value of data to them and their corresponding WTP (Figure 1). The methods to assess WTP are contingent on whether data behave as physical assets (revealed preferences) or intangible assets (stated preferences). We understand revealed preferences from market data and experiments, while stated preferences are directly or indirectly uncovered through surveys.
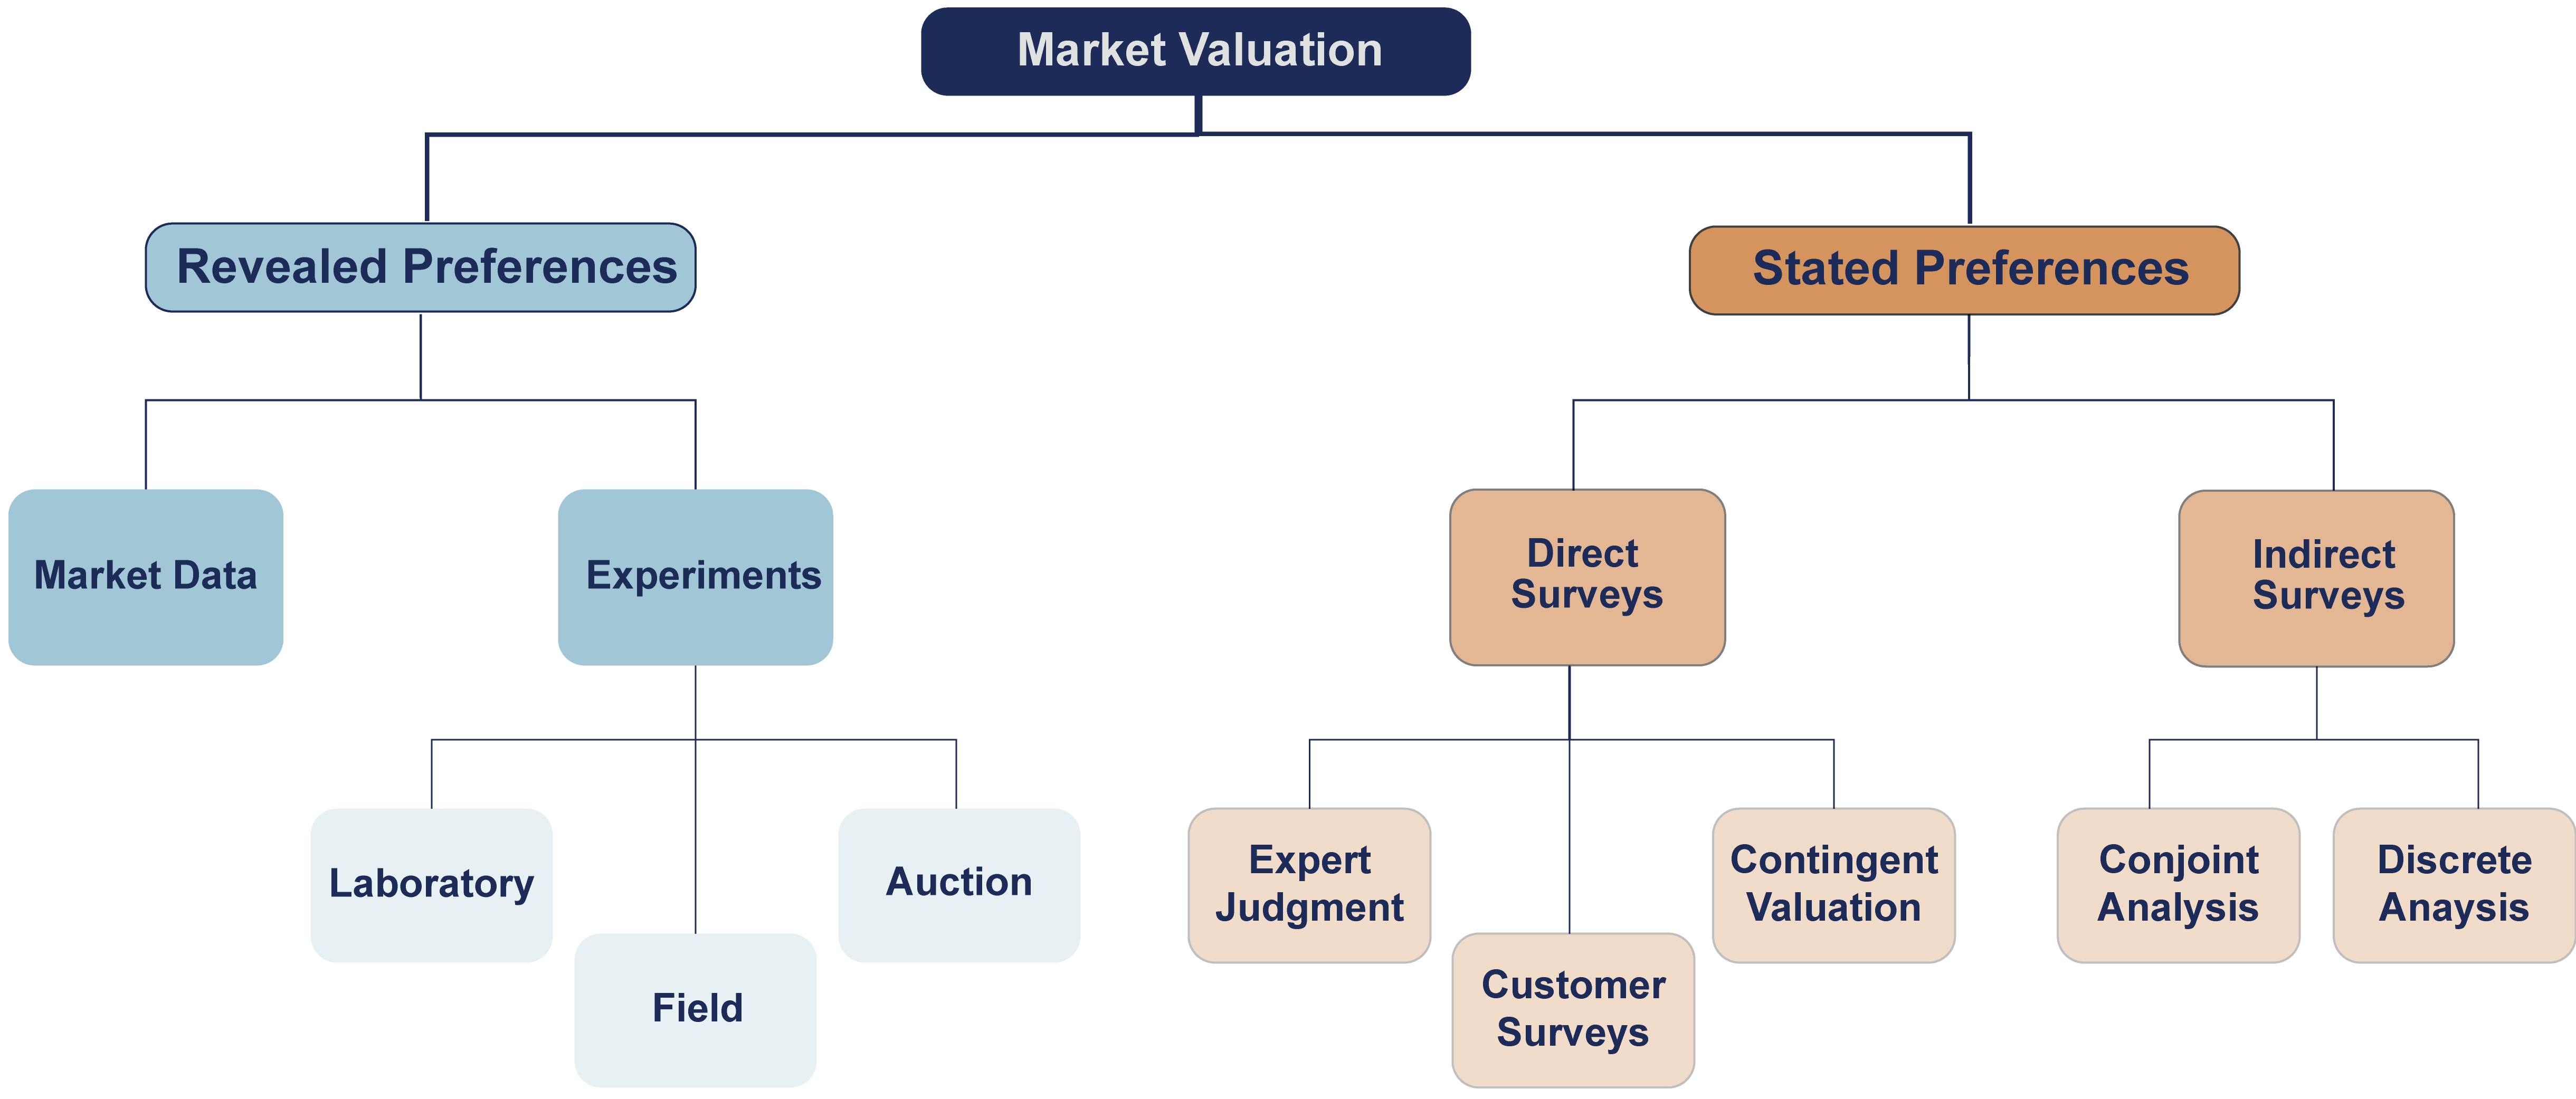
Figure 1: Market methods for revealed and stated preferences.
Revealed preferences
Market data methods
Market data methods are only applicable if water data are a commodity where actual sales are occurring. The value of the data is the market price that balances supply and demand. Examples of water data entering the market include charging data users per:
- download. Prior to 2008 Landsat Imagery had a price per image downloaded.
- service. WatrHub pulls together data needed for specific projects.
- subscription. B3 and Global Water Intelligence charge an annual subscription fee for access to their data and tools.
Once in the marketplace, the value is found by observing the impact of each price adjustment on the number of users and/or downloads.
Typically, charging for raw data access leads to decreased usage or market failures due to data’s unique attributes (such as infinite users for small marginal costs) and their value is tied to end use. As a result, for data to enter the market they often be transformed into higher quality products or services (information). For instance, B3 collects, cleans, and combines water rights and property data to understand the water security of future investments. WatrHub collects, scrapes, and converts pdfs into digital data that match upcoming utility infrastructure needs with potential technological solutions.
Experiment methods
Another way to discover revealed preferences before market entry is through experiments using laboratory, field, or auction methods.
Laboratory methods simulate purchase behavior by giving participants a sum of money and asking them to spend the money on a selection of goods. Both goods and prices vary systematically and user choices are observed. This approach provides quick results, but it can also introduce biases because of limited choices and the participants not spending their own money.
Field methods attempt to overcome these biases by following real customers. For instance, a company may vary prices for the same sandwich at different fast food store locations. Location A may offer a sandwich for $4.50, whereas Location B offers it for $7.00. The difference in the number of purchases based on price can be used to determine the value the sandwich to consumers (controlling for other socioeconomic variables). In the digital economy, companies may provide two versions of a website and collect usage statistics to determine the higher value website. A similar approach may be used to discern which data or interface is most valuable to users.
Auction methods allow customers to reveal their WTP by bidding on a product. Each participant simultaneously submits a bid and the sales price is based on bid distribution. To avoid bias, the participants need to have buy-in, meaning the winning participant pays real money for a real product. Often, the second or third highest bid is selected as the ideal market value. This method is unlikely to work for data because the value of data is transient and end use dependent.
Stated preferences
Direct survey methods
When data behave intangibly, the value is estimated by the stated preferences of survey respondents. Expert judgments, customer surveys, and contingent valuation are three commonly used types of direct survey methods to estimate WTP.
Expert Judgment methods provide a quick and cost effective way to estimate value. Expert judgment could be immensely valuable when there are known use cases for data. For instance, the value of data in a flood event will be better estimated by emergency responders than someone in a non-related profession. Currently, the value is often communicated via anecdotal stories rather quantitative value. This method is best suited when there is a clear use case; however, over-bias by experts is a concern.
Customer Surveys are used to identify (1) the price above which you would not buy a product because the cost is too prohibitive and (2) the price below which you would not buy a product because the quality becomes suspect. Customers are asked to write-in their WTP. This typically creates over-bias because it is easy to generously value a product on paper, and stated preferences do not mean they would necessarily buy the product in real life. Additionally, stated preferences are not stable. The same survey sent to the same customer could produce different results depending on survey timing or customer mood when filling out the survey. Because of these biases, customer surveys are generally not recommended.
Contingent Valuation asks respondents their WTP to pay for a specific good, or their willingness to give up a good. This method is preferred for intangible assets (such as water quality or ecosystem services) where market failures are widespread. Despite skepticism, contingent valuation has been widely adopted by government agencies to assess the value of non-market services. For instance, the USGS used contingent valuation to understand the value of Landsat imagery and users’ WTP using a series of Yes/No questions combined with randomly assigned dollar ranges. This method controls for over-bias by providing values rather than allowing customers to write-in values.
Indirect survey methods
Conjoint and discrete choice analysis are indirect survey methods where customers are asked to select between pricing options for attributes within a product or between product versions.
Conjoint Analysis methods systematically vary the attributes and prices of a single product and asks respondents to determine which version of the product they would be willing to purchase. Several versions of the same product are presented in pairs, with the respondent choosing between each pair (Figure 2). The preferences for each product profile are ranked to assess the most valuable attributes. For example, when considering different types of bottled water – does it matter if the water is from a spring or a utility, flavorless or flavored, lemon or lime, flat or carbonated. The primary challenges for this method are:
- the full price is rarely assessed as much as the additive value of different attributes,
- it is not clear that varying attributes and prices is additive (rather than multiplicative), and
- it only considers those willing to buy some version of the product and does not explore the underlying choice of whether to buy at all.
For data, you might want free data, or you might be willing to pay $100 for cleaned data, or you might be willing to pay $500 for data converted to information.
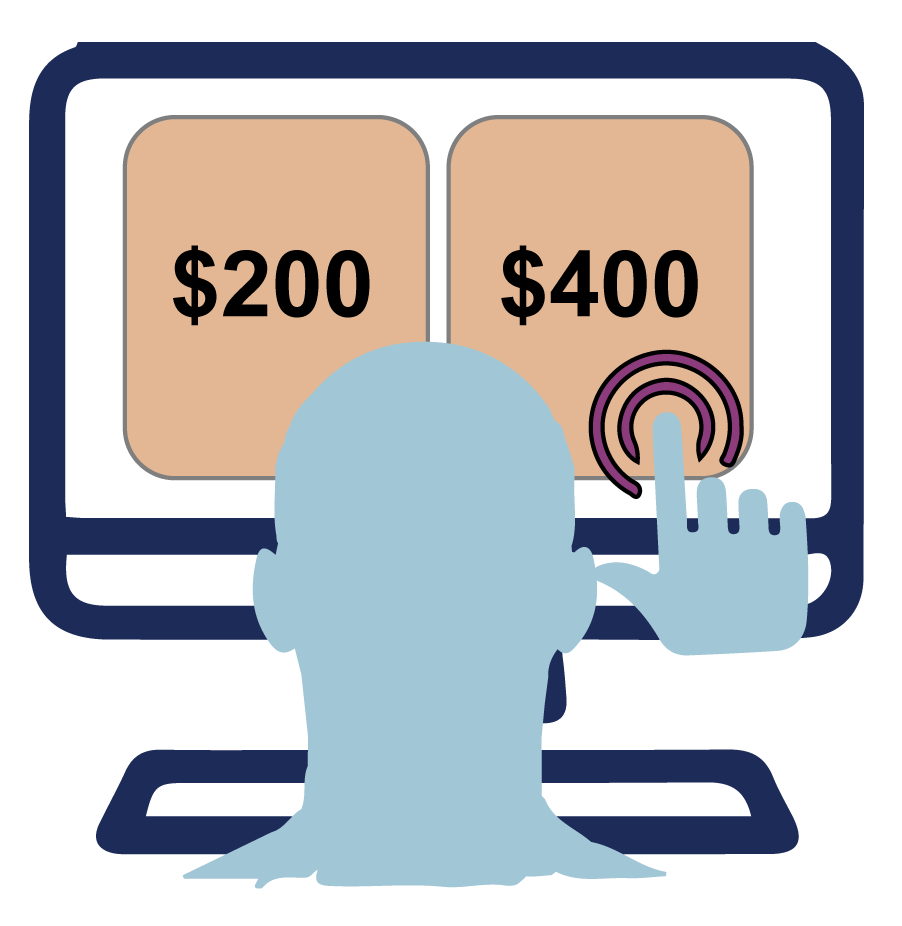
Figure 2: Survey respondent is asked to choose between pairs of options.
Discrete Choice Analysis are similar to conjoint analysis except that instead of asking respondents to choose between different variations of the same product, they are asked to choose between different products (or choose none of the products). Similar to the conjoint analysis, the decisions are ranked and ordered to assess the value of each product.
For more information:
- Bergie, N. and J. Houghton. 2014. The Value and Impact of Data Sharing and Curation: A synthesis of three recent studies of UK research data centres.
- Breidert et al. 2006. A Review of Methods for Measuring Willingness-To-Pay.
- Miller et al. 2013. Users, Uses, and Value of Landsat Satellite Imagery – Results from the 2012 Survey of Users.
- Moody and Walsh. 1999. Measuring the Value of Information: An Asset Valuation Approach. European Conference on Information Systems.
- Pearce, D.W. and Ozdemiroglu. 2002. Economic Valuation with Stated Preference Techniques: Summary Guide. Department for Transport, Local Government and the Regions.