Stream gage data improves flood management
By Lauren Patterson
Method – Business Model Maturity Index, Direct Survey
Categories – water quantity, infrastructure, government

U.S. Geological Survey stream gage data are used by organizations to better manage floods through reservoir operations and design, flood forecasting, and floodplain management. The estimated benefits of stream gage data for flood-related decisions were assessed by the USGS through direct surveys. We applied the Business Model Maturity Index method to estimate the relative contribution of stream gage data to flood control for three use cases. The value of data varied dramatically depending on whether the data were considered responsible for the full benefit of flood management decisions or a relative contribution to the decision.
Organization: data producer and data hub
The water resources mission of the United States Geologic Survey (USGS) is to collect and disseminate reliable, impartial, and timely information that is needed to understand the Nation’s water resources. Stream gage data is one type of data collected that the USGS collects and makes discoverable and accessible through the National Water Information System (NWIS).
Primary data purpose: Decision-Making and research
Stream gage data are primarily collected for decision-making and research purposes. The USGS also shares some gages and sensors with other organizations (such as the Army Corps of Engineers or state agencies) who use those data for operational purposes (such as reservoir operations) or regulatory purposes (such as water quality compliance).
Benefits of USGS stream gage data
For more than 150 years the USGS has collected, managed, and shared streamflow data. The number of gages peaked at over 9,000 active gages in 1968 and has since declined to around 7,800, primarily due to lack of funding.[1] Aside from tracking the number of downloads, the USGS has no formal mechanism to track who is downloading data from NWIS nor how those data are being used. To better understand how data are used, the USGS surveyed the organizations that cost shared stream gages with the USGS. From this, the USGS identified nine use cases:[2]
- Plan, design, operate, and maintain water management systems (operational)
- Issue flood warnings to protect lives and reduce property damage (operational/decision-making)
- Design highways and bridges (operational/decision-making)
- Map floodplains (decision-making)
- Monitor environmental conditions and protect aquatic habitats (regulatory)
- Protect water quality (regulatory/decision-making)
- Manage water rights and transboundary water issues (regulatory/operational)
- Education and research (research)
- Recreational uses (decision-making)
Estimating value
From this list, the USGS chose to study three use cases related to flood management: (1) reservoir design and operations, (2) flood forecasts, and (3) floodplain management (Figure 1).
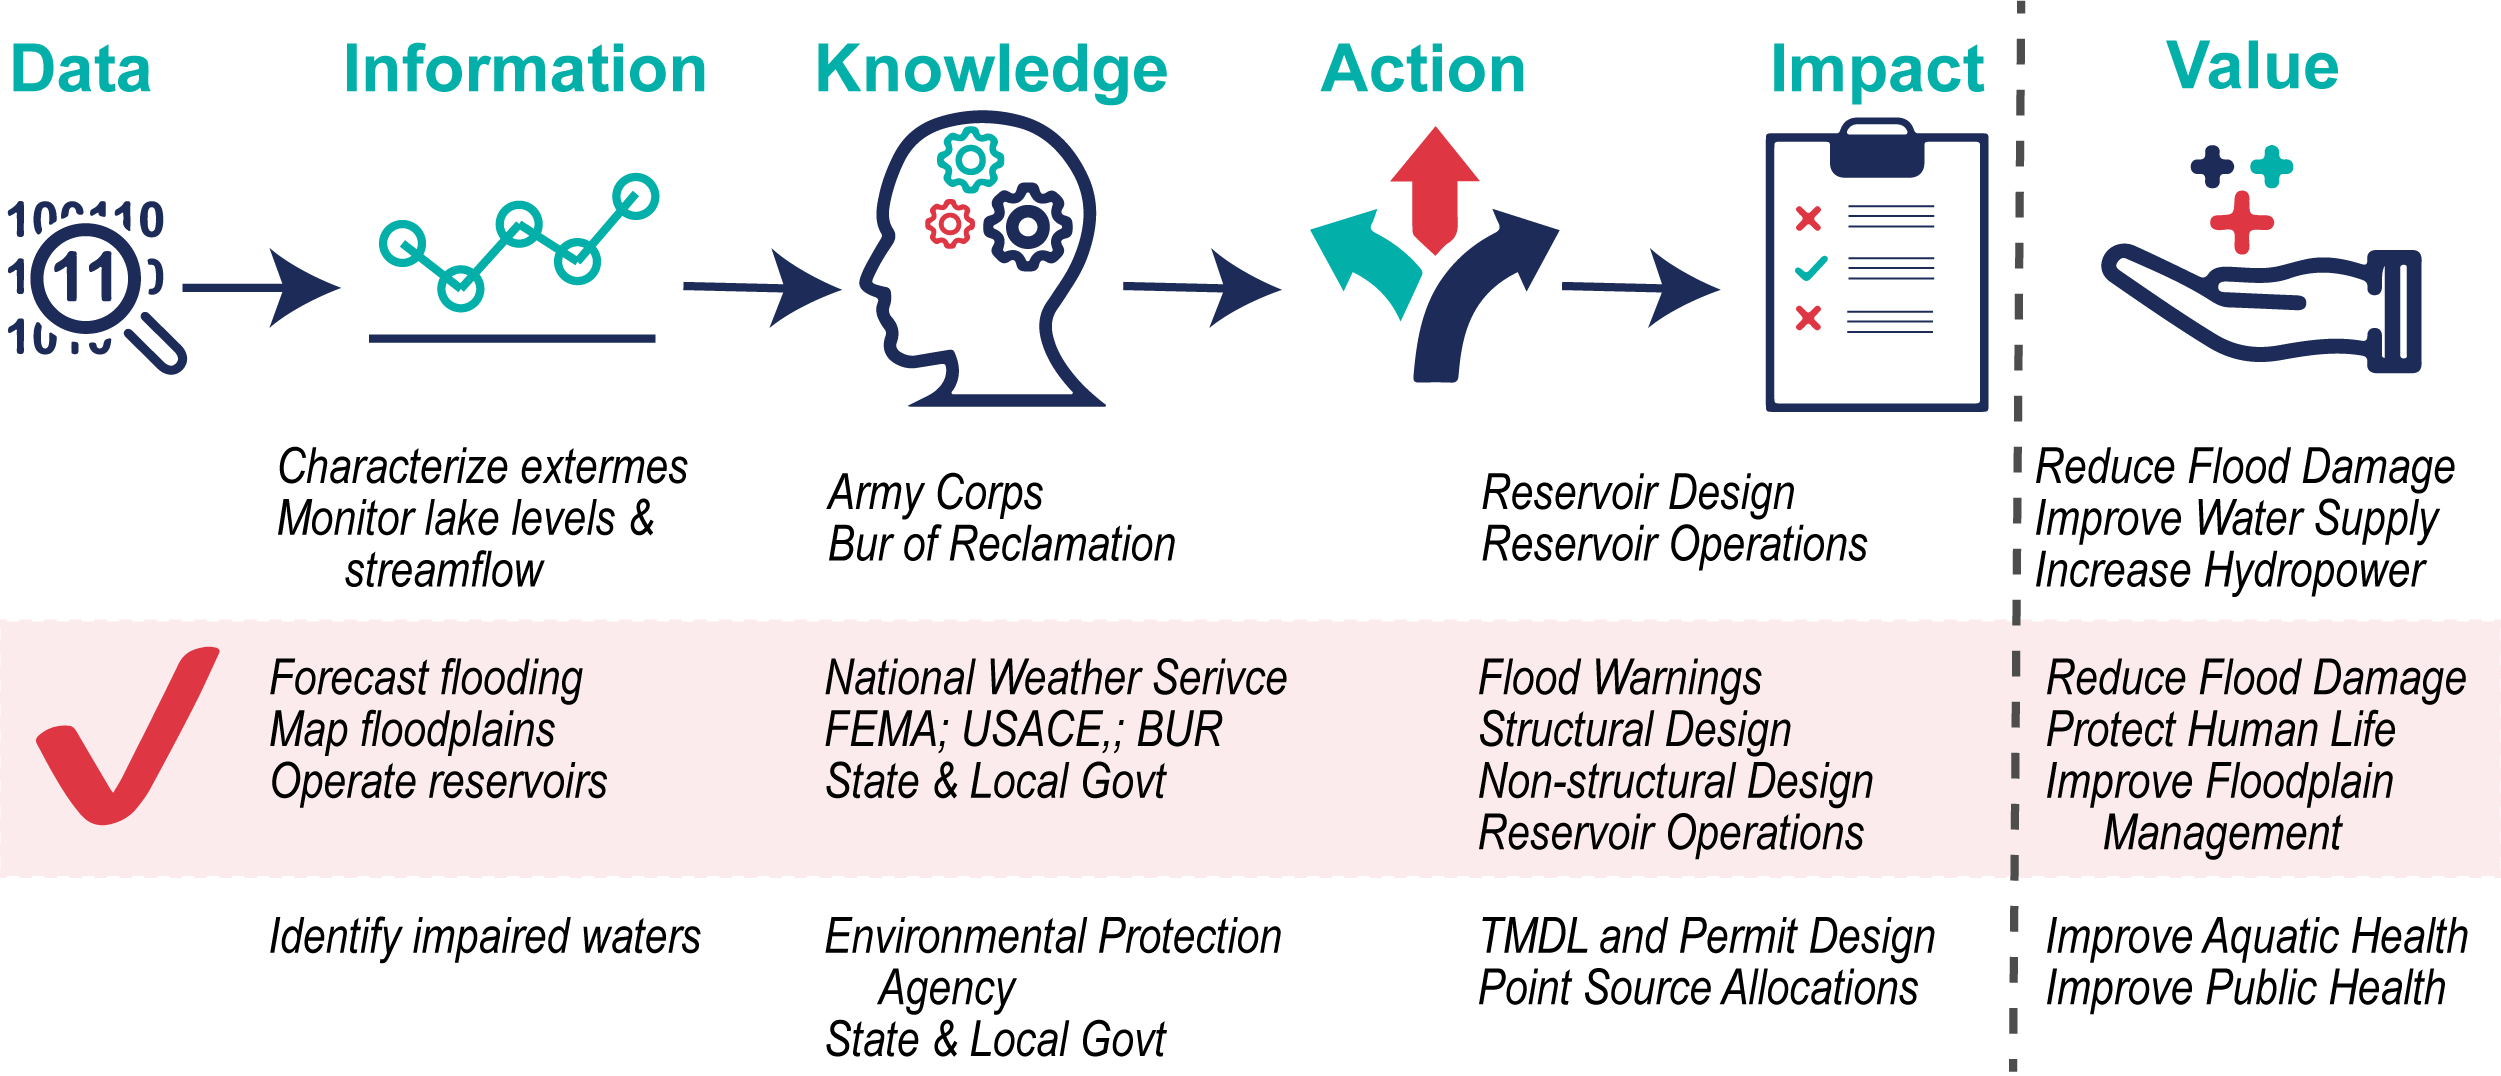
Figure 1: The flow of stream gage data to information to impact.
Costs
In 2006, the annual cost to the USGS to collect, manage, and share streamflow data was $127M.[3] In 2017, the cost for a single gage was $32,500 to install and $18,850 for annual operation and maintenance.[4]
Use Case 1: Reservoir design and operations – City of Sacramento, CA
Water-related infrastructure (like bridges, culverts, levees, and reservoirs) are designed to function under normal and extreme conditions. These infrastructure are usually designed to withstand a flood event that is likely to occur once every 100 to 200 years (and have less than a 1% chance of occurring each year). Stream gage data are needed to estimate the size of these events. The accuracy of these estimates typically improves with more data collected over longer periods of time (see Box).
The impact of long-term data on infrastructure design
Longer periods of record increase accuracy and reduce uncertainty when estimating the size of flood events. Here we look at the impact of data record length on estimating the size of the 100-year flood for the North Fork of the American River, California, is located above Folsom Dam. With a data record of 10 years, the 100-yr event was estimated to have a streamflow of 1,251 cms. With 30 years of data, the estimated 100-yr event is 28% larger at 1,640 cms. This means a dam designed with 10 years of data would not be sized correctly to withstand the larger streamflow events evident in the longer record and the dam would not be able to withstand the 100-year flood event. Using 70 years of data the size of the 100-yr event didn’t change, but does increase the confidence in the estimate (tighter confidence range).
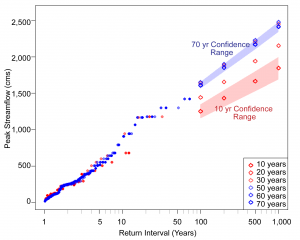
Box Figure: Change in 100-yr to 1000-yr event as more data was collected over time for the same stream. The bands are the confidence range for flood estimates using 10 years and 70 years of data.
Folsom Dam, which protects Sacramento City from flooding, was designed to withstand a 250-yr flood event. After the dam was constructed, the region experienced five flood events between 1951 (when construction started) and 1997 that exceeded the largest event in the 35-year record used to design the dam. These flood events and the additional years of data suggest the dam was only sufficient to protect Sacramento City from a 100-yr flood. In response, the dam was retrofitted (completed in 2017) for $900M to withstand a 200-yr flood.[5]
The $900M in retrofit costs are could have been avoided if the 50 additional years of streamflow data had been available when the reservoir was designed (the value of those data). There are 23 stream gages along the American River, assuming all were used to design the retrofit, the cost of those gages is $22.4M over 50 years (based on the 2017 cost for a single gage). The benefit-to-cost ratio ($900M/22.4M) is $40.13 in value for every $1 spent.
Stream gage data are just one type of data used to design reservoirs. A more accurate representation of the value of this data would be to assess the relative contribution of streamflow data. If the stream gage data were one of 50 equally valuable pieces of data, the relative contribution of stream gage data is $18M ($900M*1/50), resulting in a benefit-to-cost ratio of $0.80 ($40.13/50) for every $1 spent.
Use Case 2: Flood forecasting – National Weather Service
The National Weather Service integrates data such as air temperature, melt level, precipitation, soil, hydrologic geofabric (NHDplus), infrastructure, and streamflow data to create flood forecasts. Historic streamflow data are used to calibrate models while real-time data are used to validate model accuracy and make adjustments during an event. These data are used to generate increasingly accurate, advance warnings that can reduce the total amount of damage during a flood event.
There are two primary ways data can improve flood warning and emergency response.
- Earlier alerts and warnings. Studies estimate that improving the warning time from 0 to 4 hours can reduce the flood damage by 10 percent (Figure 2).[6] Earlier warnings and alerts are made possible as data become more timely and interoperable, and computational speeds increase.
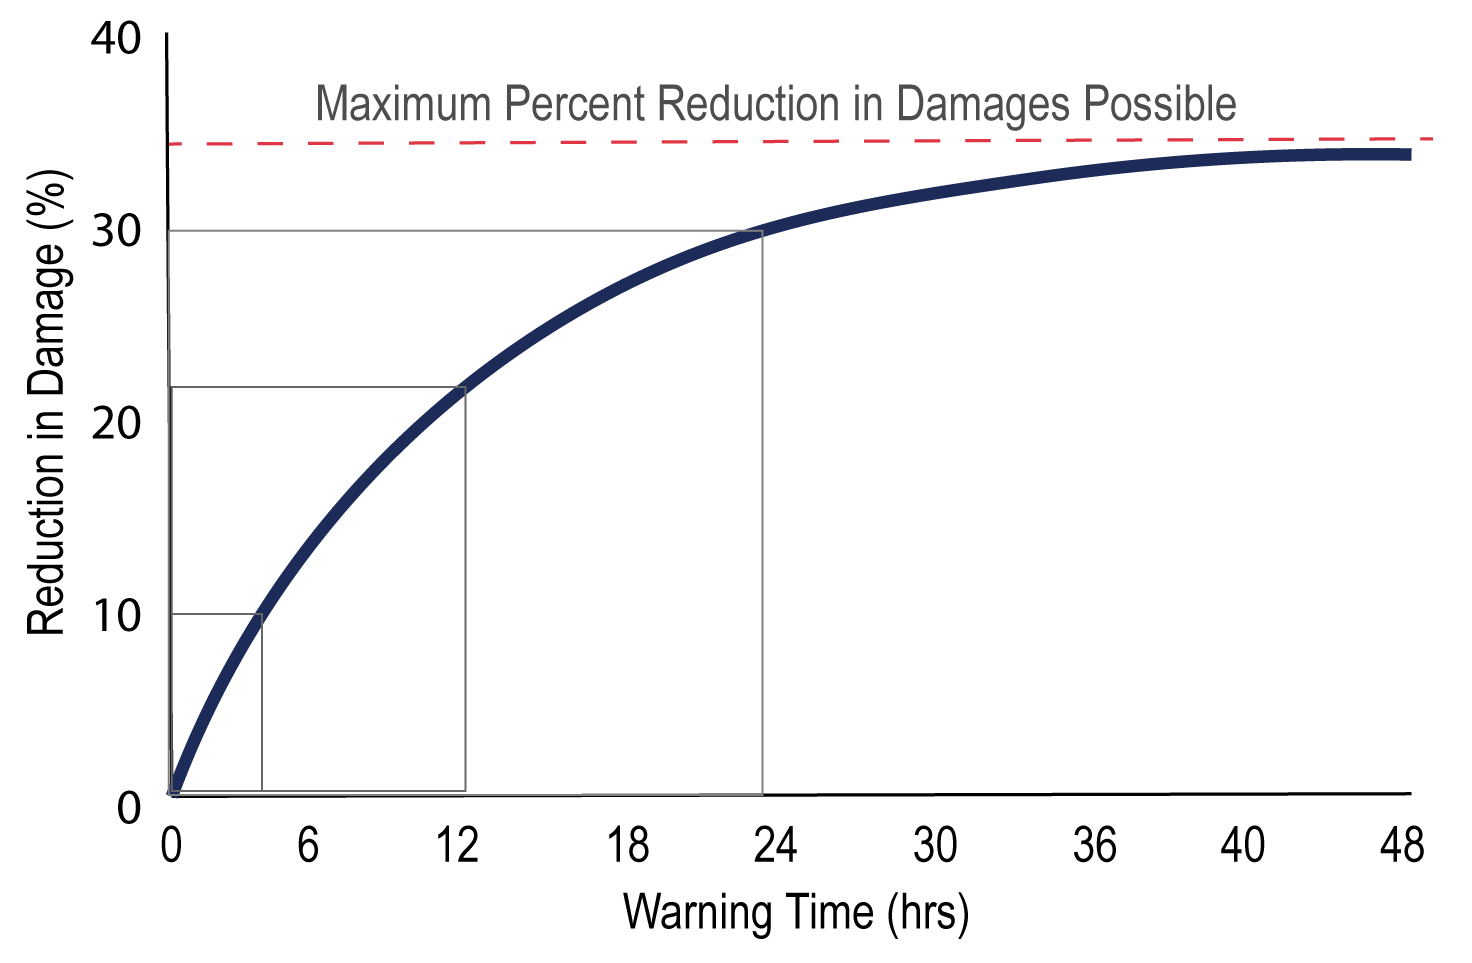
Figure 2: Data leading to earlier and more accurate flood warnings can reduce damages.
- More accurate forecasts. The number of gages is also important for accurate flood forecasts. For example, Ohio discontinued a number of stream gages in the 1990s due to funding shortfalls. Fewer gages reduced the quality of their flood forecasts, leading the state to reverse course and reactivate stream gages.[6]
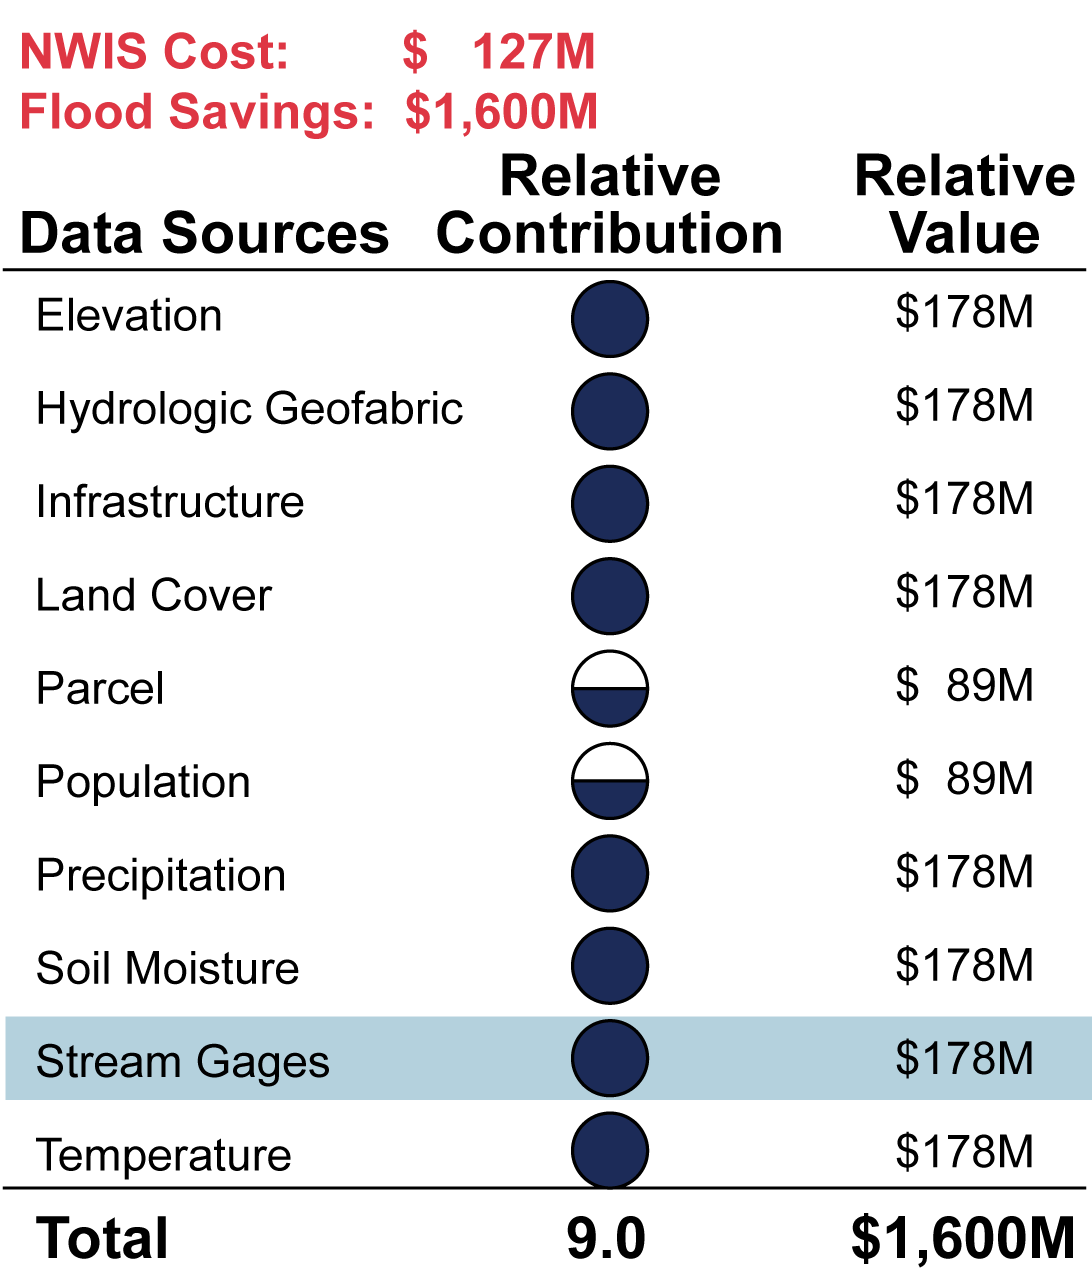
A 2002 study estimated the National Weather Service Hydrologic Forecasts saved $1.6B annually by optimizing reservoir operations (63% of the $1.6B), improving emergency response with short-term forecasts (27%), and enabling better preparation with long-term forecasts (710%).[7]
Assuming the USGS stream gage data are responsible for the full $1.6B, then the benefit of the data is $12.60 for every $1 spent ($1.6B/$127M). But again, stream gage data are only one type of data needed to create flood forecasts. A more conservative valuation can be obtained by applying the Business Model Maturity Index method (Table 1). Here, we assume stream gages are a fraction of the data needed for flood forecasts, contributing to $178M of the annual savings. The relative contribution of stream gage data produces $1.40 in benefits for every $1 spent on stream gage data.
Table 1: The relative contribution of data (0 to 1; empty to full circle) and the data’s relative value to flood savings.
The USGS also estimated the benefit of stream gage data on reservoir operations during flood events reduces flood damages by $30M to $50M annually,[6] producing a benefit of $0.24 to $0.39 for every $1 spent (assumes all stream gages are linked to reservoir operations).
Use Case 3: Floodplain management – City of Charlotte, NC
The National Flood Insurance Program provides flood insurance for buildings located within the 100-year floodplain. The 100-year floodplain is the area that is likely to be flooded during an event that has a 1% chance of occurring each year (over a 30 year mortgage there is a 26% chance of experiencing a 100-yr flood). The 100-year floodplain is delineated from stream gage, elevation, soil type, precipitation, land cover, infrastructure, hydraulic data, and existing flood maps.[8] The 100-year floodplain changes with climate and landscape alterations, such that maps should be updated every 10 years.
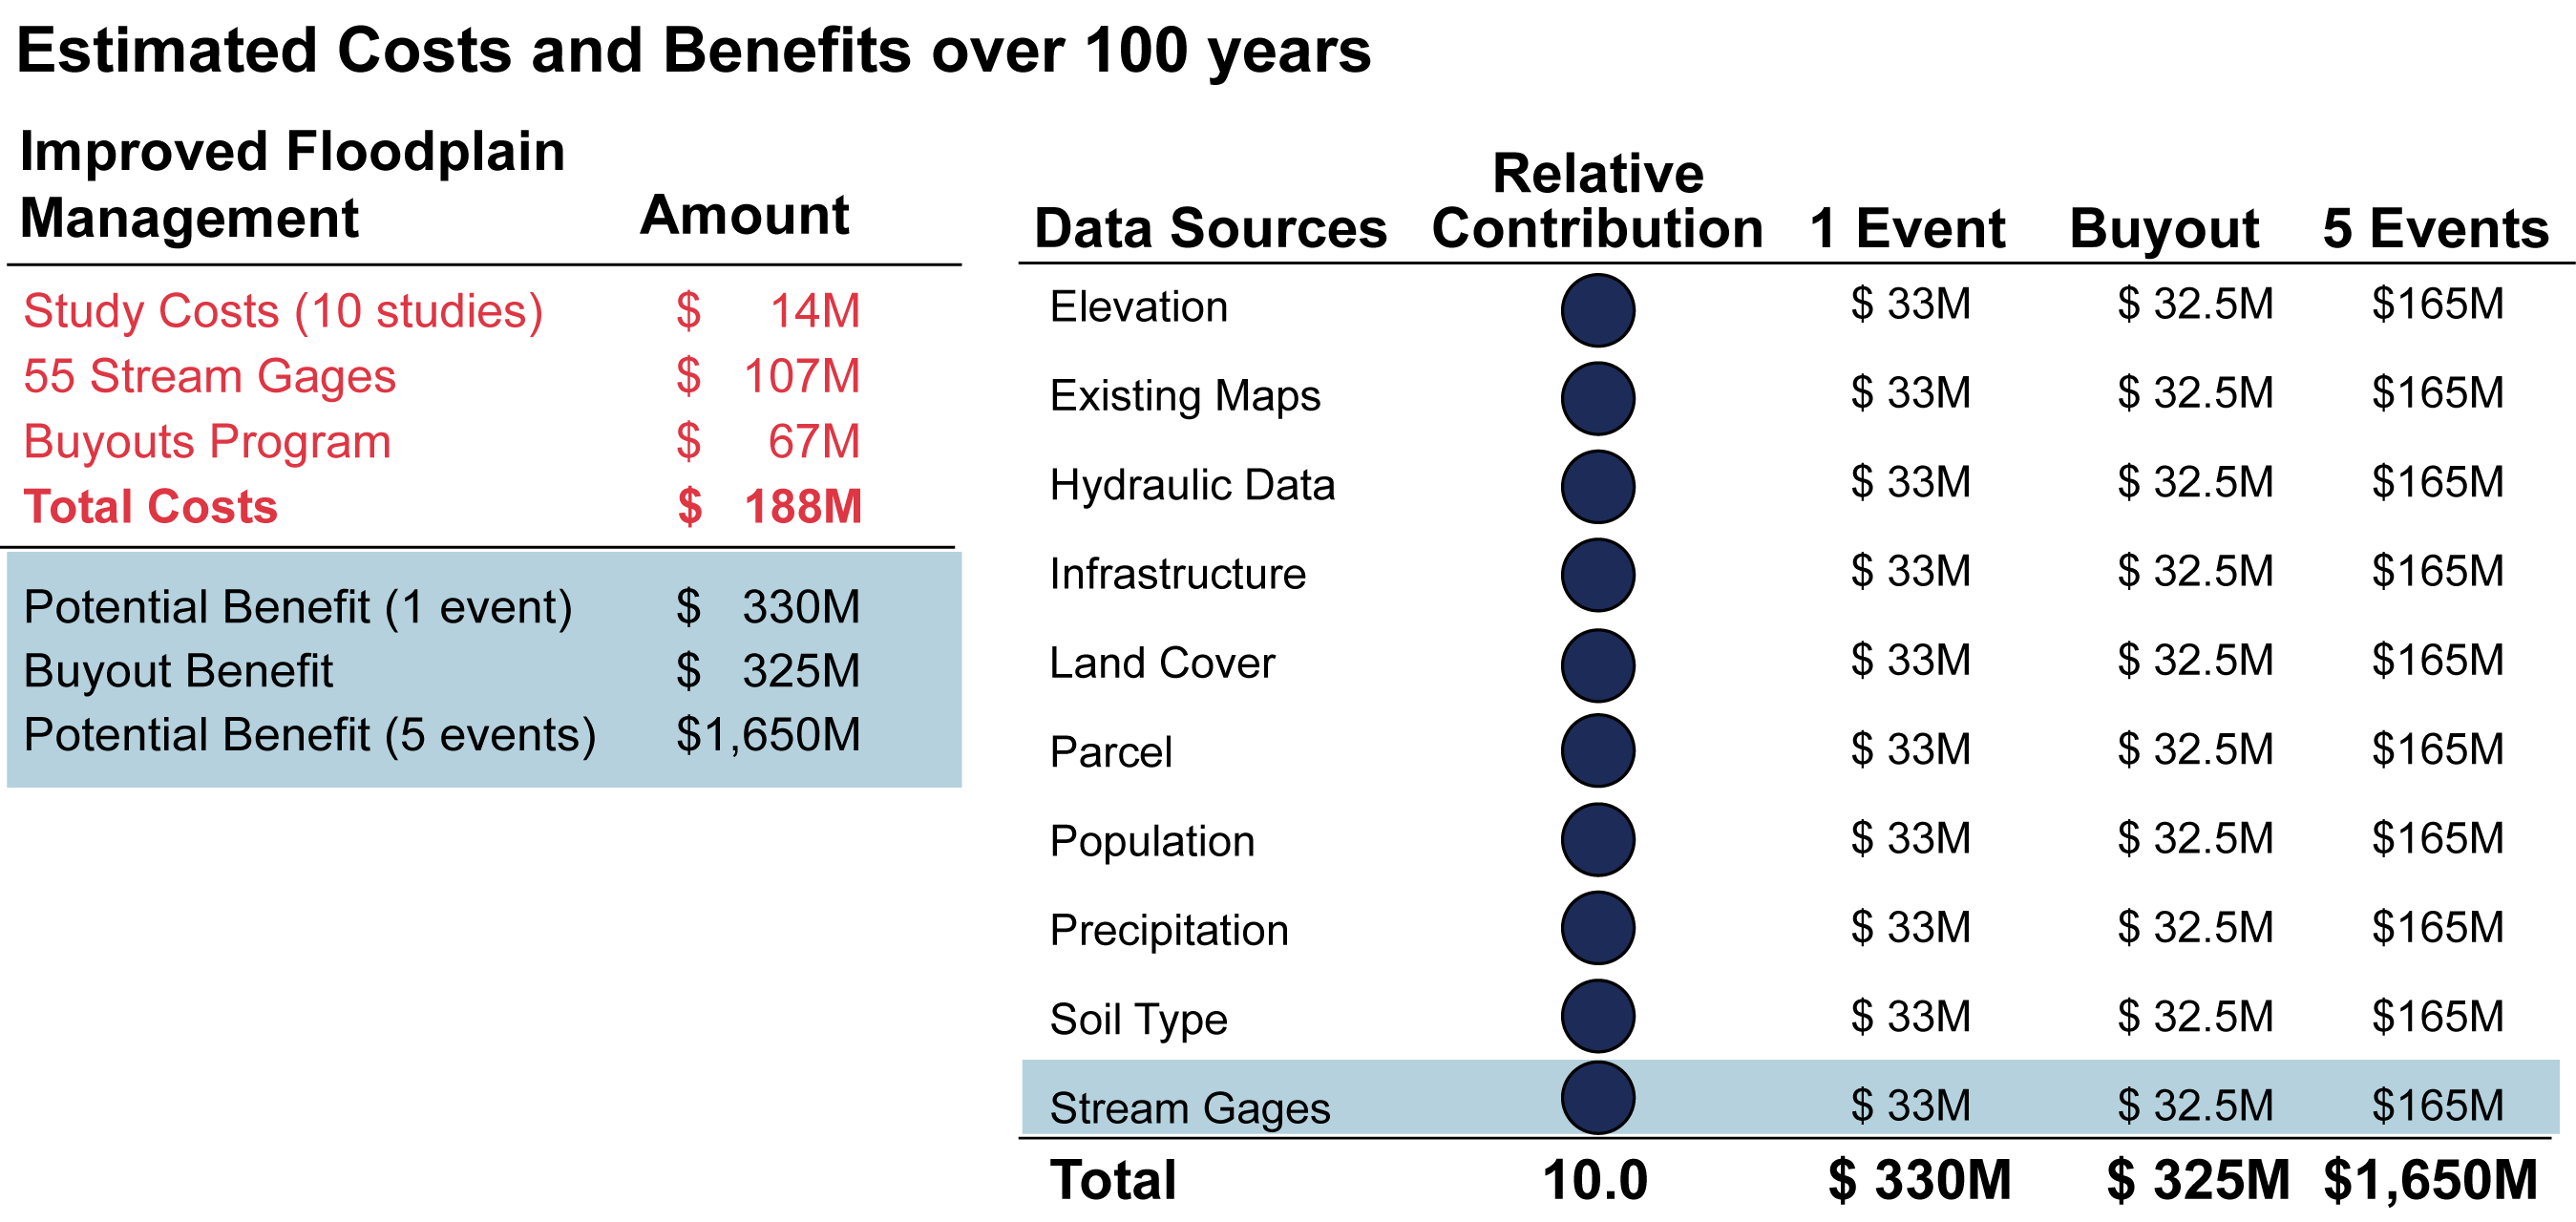
Charlotte, North Carolina experienced two large flood events in succession in 1995 and 1997 resulting in $80M in damages and the flooding of homes outside of the 100-year floodplain. The City spent $1.4M to update their floodplain maps in 1999 and found that average flood elevations extended 4.3 feet higher and encompassed an area 160 feet wider than described by current maps[9]. Charlotte invested in 55 new USGS stream gages to further improve flood forecasting and floodplain delineation. The City also invested $67M into their property buy-out program.[10] Assuming a new study is done every 10 years, and new gages purchased every 50 years, the total cost of floodplain management for Charlotte over the next 100 years is estimated to be $188M.
The City estimated that more than $330M in flood damages could be avoided by not building in the updated floodplain areas and prioritizing buy-out programs. To date, over 400 homes have been purchased, saving over $25M in damages from flood events that have occurred since 1999, and it is anticipated purchasing those homes will save an additional $300M from future flood events.[10]
The estimated benefits over the next 100 years are:
- Initial estimate: $330M
- Buyout program only estimate: $325M
- Assumes five 100-year events occur: $1.65B
If we assume stream gage data are responsible for all benefits, they save $1.73 for every $1 spent on the buyout program ($325M/$188M) and they save $8.76 if the city experiences five 100-year events ($1.65B/$188M) are saved for every $1 spent. If we assume, stream gages provide 10% of the data needed for floodplain management, then $0.31 and $1.54 are saved for every $1 spent on stream gage data for the buyout program or the experience of five 100-year flood events (Table 2).
Table 2: (Left) Estimated costs (red) and benefits (blue) over 100 years. (Right) Relative contribution and value of data sources to improve floodplain management.
Final thoughts
The benefits estimated in these use cases accrued to the communities protected from flooding. While the stream gage data clearly helped the USGS meet their mission, it is unclear if any economic value was directly realized by the agency. The overall benefit-to-cost ratio for stream gage data in terms of flood events ranged from $0.24 (reservoir operations) to $12.6 (flood forecasts) for streams without reservoirs (Figure 3). It’s important to remember that stream gage data are often a fraction of the data needed to produce actionable information and their value should be adjusted using the Business Model Maturity Index or the Decision-Based Valuation method to account for their relative contribution. The value of data varies dramatically depending on whether data are valued for their relative contribution or the full benefit of a use case.
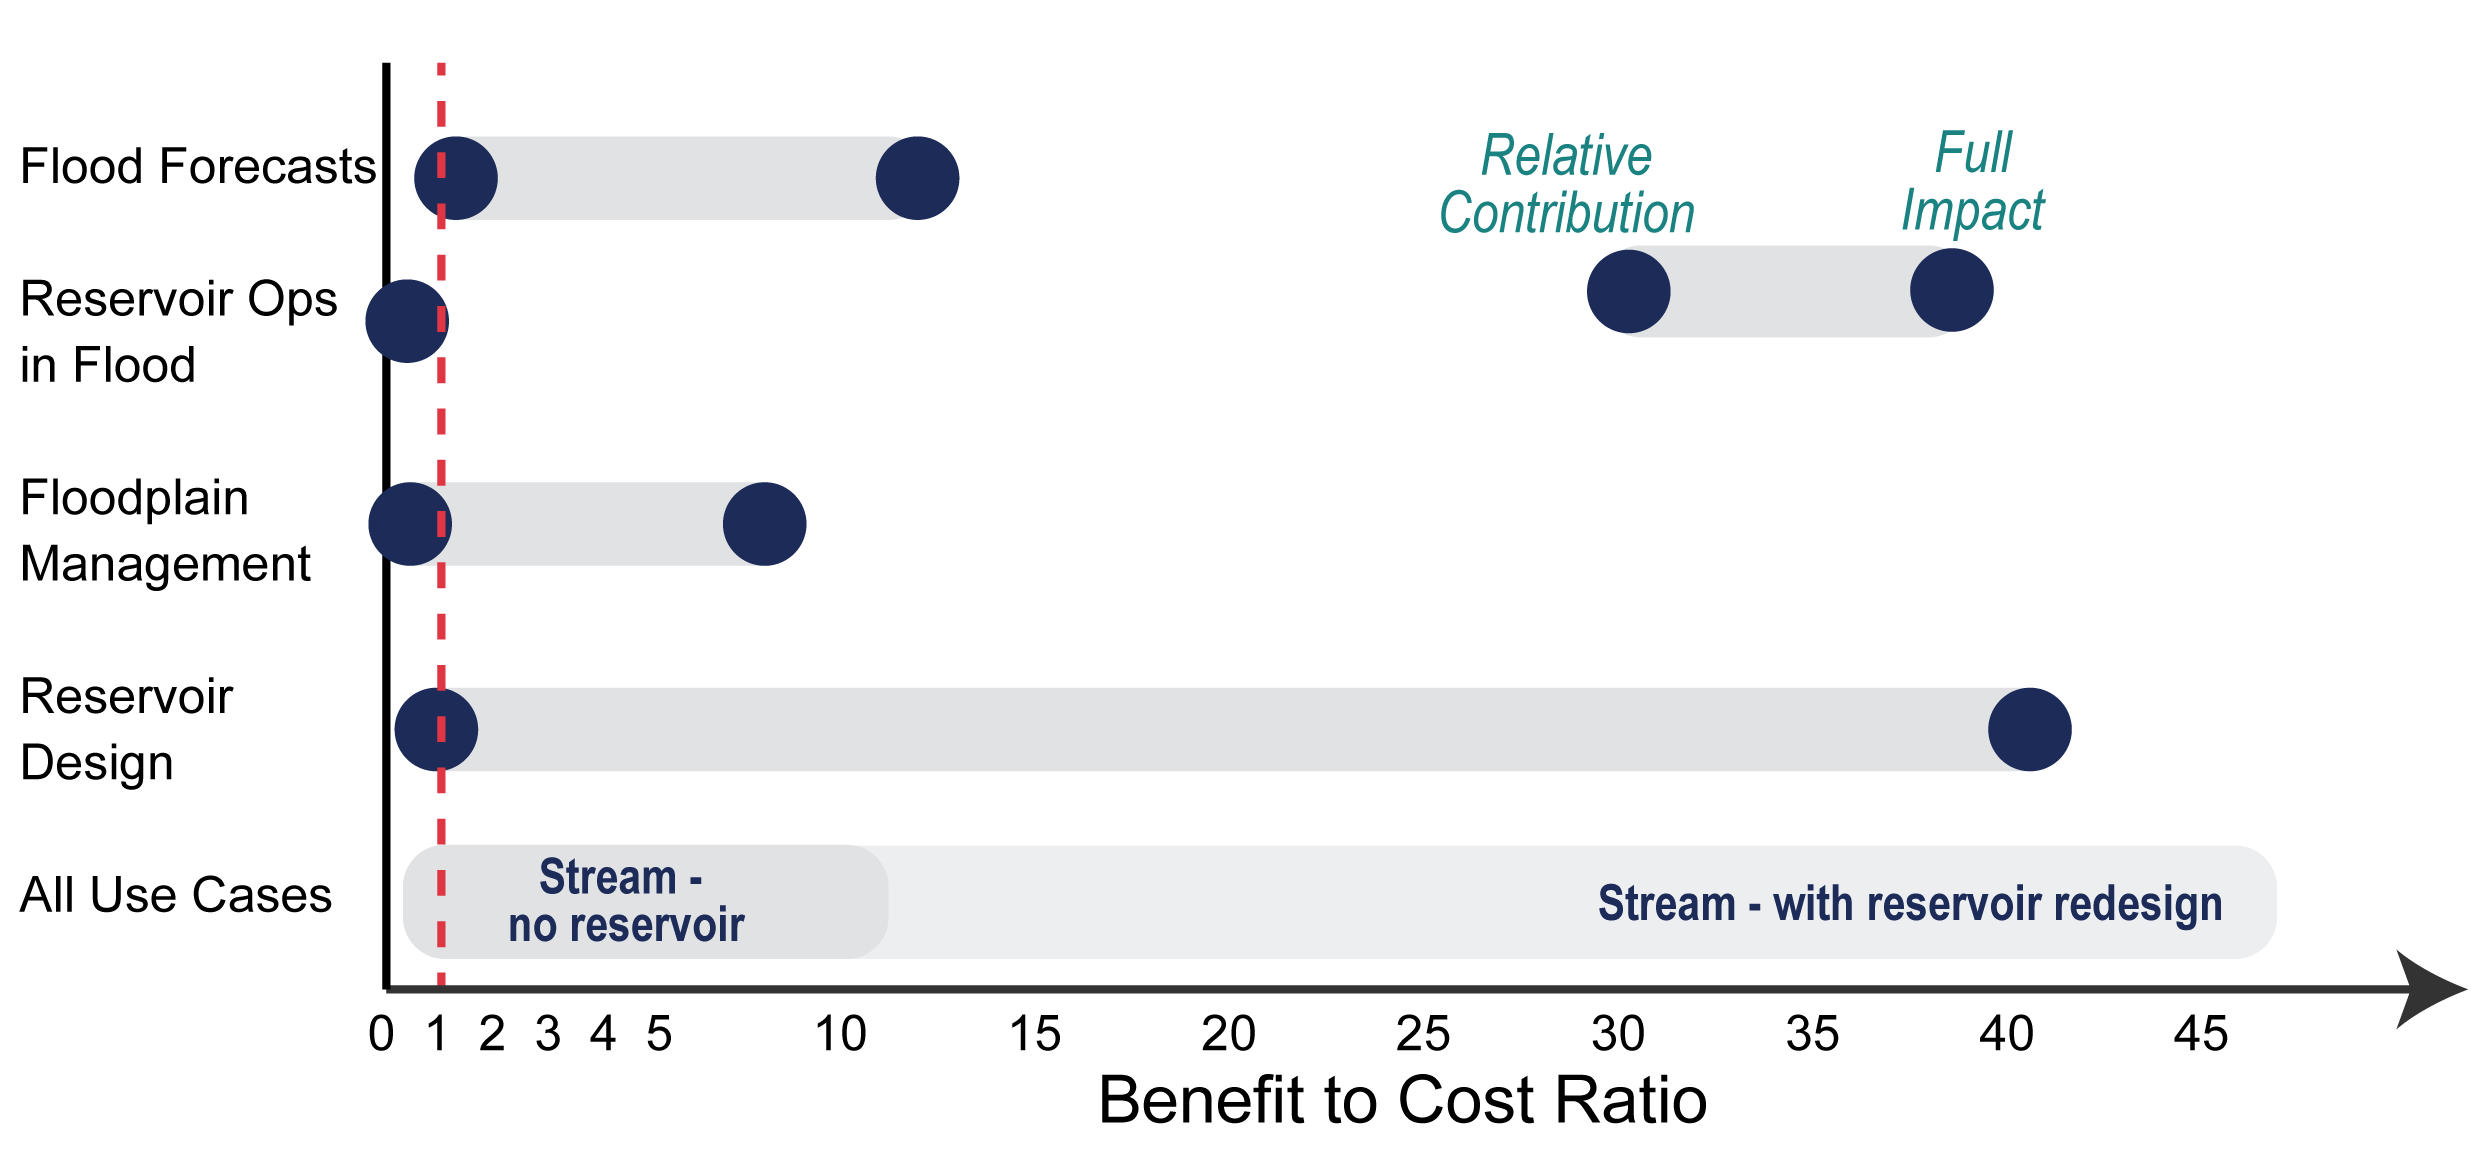
Figure 3: Benefit-to-cost ratio of stream gages for all flood management examples.