Keeping Research Data Safe method
Last Updated November 26, 2018
Keeping Research Data Safe (KRDS) is a method data repositories use to track their costs and benefits. While designed for research-based data repositories, the method can be modified to describe the value data hubs create by integrating and sharing data.
The Keeping Research Data Safe (KRDS) method was developed by Charles Bergie (additional tools and resources) and seeks to calculate the annual (and long-term) costs of data hubs, as well as the value of hubs to data users. Hub benefits are categorized in terms of
- cost (time and money) for users to access the hub’s data,
- the savings to users from using hubs versus individually accessing data from producers,
- contingent valuation of the willingness-to-pay for hub services, and
- the impact from actionable insights resulting from the data (use cases) (Figure 1).
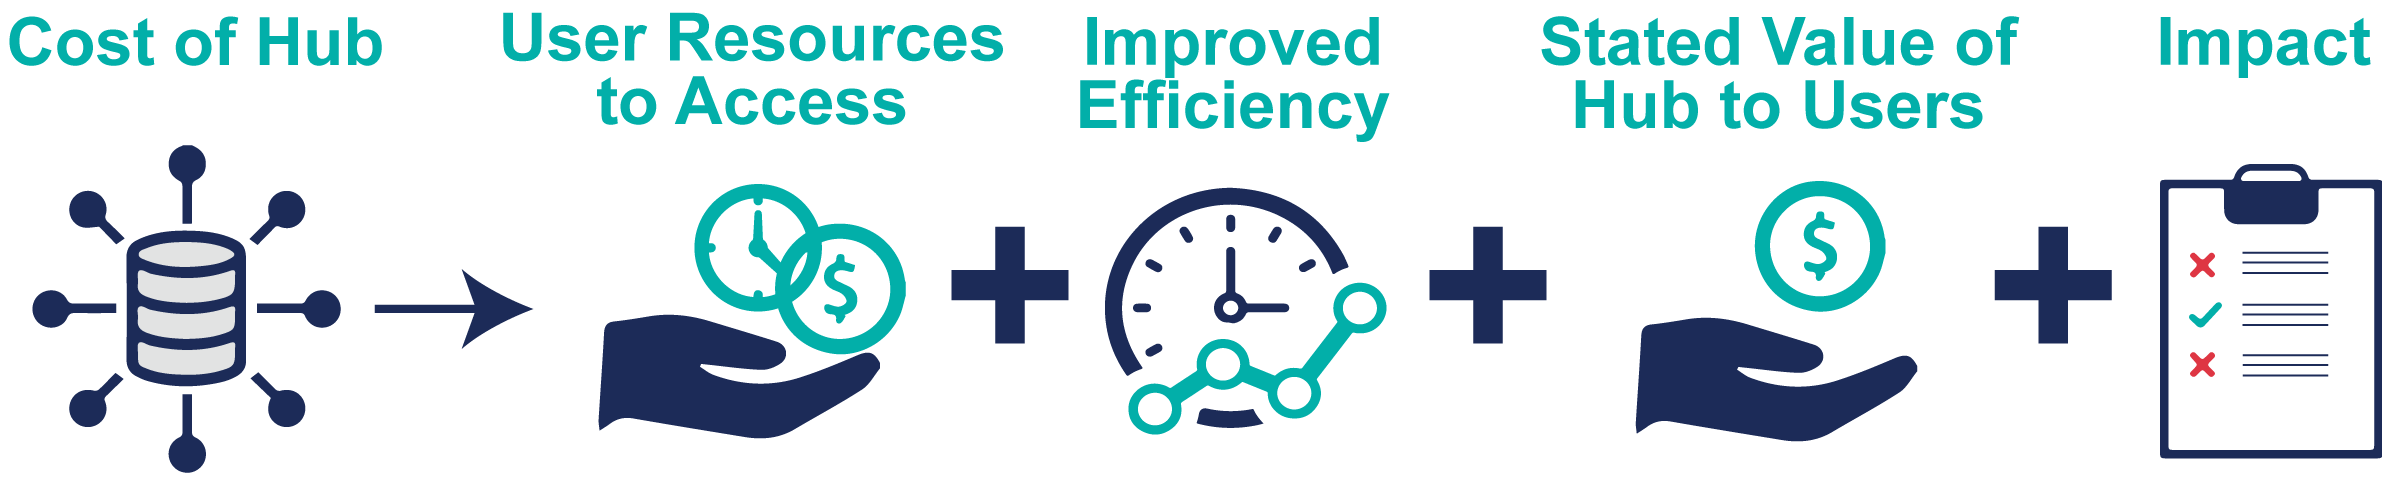
Figure 1: The costs of the hub are compared with different hub benefits.
Keeping Research Data Safe method
The KRDS method compares the cost of the hub to the value it generates by making data more discoverable, accessible, and usable. Hub value is assessed through predominately market methods.
(1) Identify the cost
The first step is to identify the cost of the data hub. This can be as simple as using the yearly expenditures or as complex as breaking out costs by individual employees or datasets. KRDS also enables users to depreciate the cost of hardware and adjust for inflation.
(2) Identify the benefits
Use cases refer to decisions and strategies that can achieve the desired outcome. For each use case, estimate the implementation cost and the potential impact. The value of the decision should be accounted for over the full life-time of the project.
(3) Adjust value based on how fit-for-purpose data are to inform decisions
The KRDS method provides three dimensions to considering each benefit: impact, timing, and who benefits.
Impact
Impacts can be direct (tangible) or indirect (intangible).
- Direct impacts refer to measurable changes such as increased usage, decreased time spent discovering and accessing data, and value creation from using data.
- Example: a data user decreases time spent discovering and accessing data by 40%.
- Indirect impacts refer to avoided costs, such as from lost or inaccessible data. Data held by hubs can avoid redundant data collection and ensure preservation and availability of data for future use.
- Example: a utility discards regulatory data on water quality after 5 years. Without a hub preserving these data, they are no longer available to assess how water quality has changed over time.
Timing
Timing can either be short-term or long-term, and refers to when benefits accrue from the data and has implications for hub funding strategies. Timing to realize benefits are linked to data purposes.
- Short-term benefits accrue within 0-5 years of implementation. Short-term data purposes are typically operational or regulatory.
- Example: An organization uses water quality data from a hub to inform the safety of recreational swimming at various water bodies.
- Long-term benefits take longer than 5 years to realize and tend to be used for purposes of broad decision-making and research.
- Example: Data from a hub are used to develop a water quality model eight years after the inception of the project.
Who
Who refers to whether benefits are realized internally or externally to the hub.
- Internal benefits are accrued by the data hub.
- Example: A state creates a data hub, requiring state agencies to push water-related data to the hub to make data more discoverable, accessible, and usable for the state.
- External benefits impact stakeholders unaffiliated with the data hub.
- Example: A researcher accesses all data in a state hub related to water quality within the Cape Fear River Basin.
Data hubs may calculate internal, direct, short-term benefits within their organization. However, for water data hubs, much of the value is likely to come from external data users, requiring survey methods to understand how data are being used to create impact and the willingness-to-pay for hub services. Surveys may also be used to improve hub usability for producers and users.
(3) Calculate the return on investment (ROI)
The ROI can be calculated for producers, hubs, and users. For example, Bergie & Hougton (2014) applied the KRDS method to three data centers and found:
- Producers had an ROI between 2 and 12 to host data on a hub rather than through their own services,
- Hubs had an ROI between 2 and 23 in terms of increased efficiency in providing data from multiple producers in one location.
- Users had an ROI between 2.2 and 2.7 in terms of willingness-to-pay and the estimated value of the hub from use cases.
ROI is solely quantitative, however many benefits are provided that are difficult to put into economic terms. KRDS encourages hubs to articulate these qualitative impacts through surveys that reveal stakeholder values and how hubs may better meet stakeholder needs, thereby raising the value of the hub.
Example application
Acme Hub maintains 50 water-related datasets. It also cleans and standardizes the data, making them more discoverable, accessible, and usable. Acme Hub surveyed their 60 data users to better understand (1) their time and cost savings from using Acme Hub, (2) their willingness-to-pay for hub services, and (3) how the data are being put to use. Acme Hub had an 80% response rate to its survey.
(1) Identify the cost of the hub
Acme hub decided to organize and estimate costs based on the annual costs for (1) labor to collect, clean, and standardize data, (2) hardware, (3) software, (4) storage, and (5) utility costs (Table 1). Total annual costs for Acme Hub were $1,252,540.
Table 1: Annual operating expenses for Acme Hub
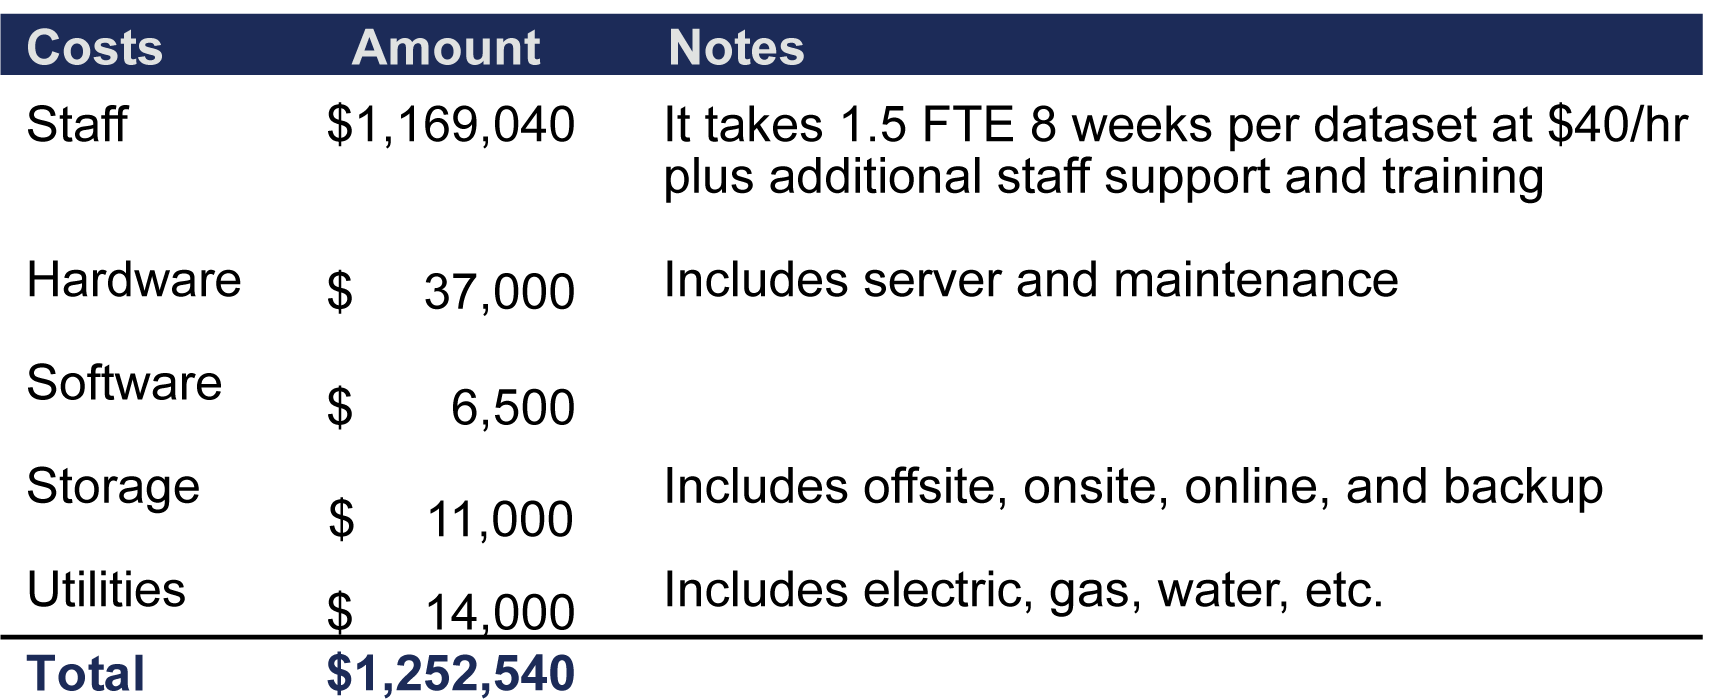
Acme Hub also surveyed their data producers and found producers would spend an estimated $325,000 to get similar levels of service as Acme Hub. Data users estimated that before Acme Hub began operating they spent $750,000 discovering, accessing, and making data usable.
Identify the benefits
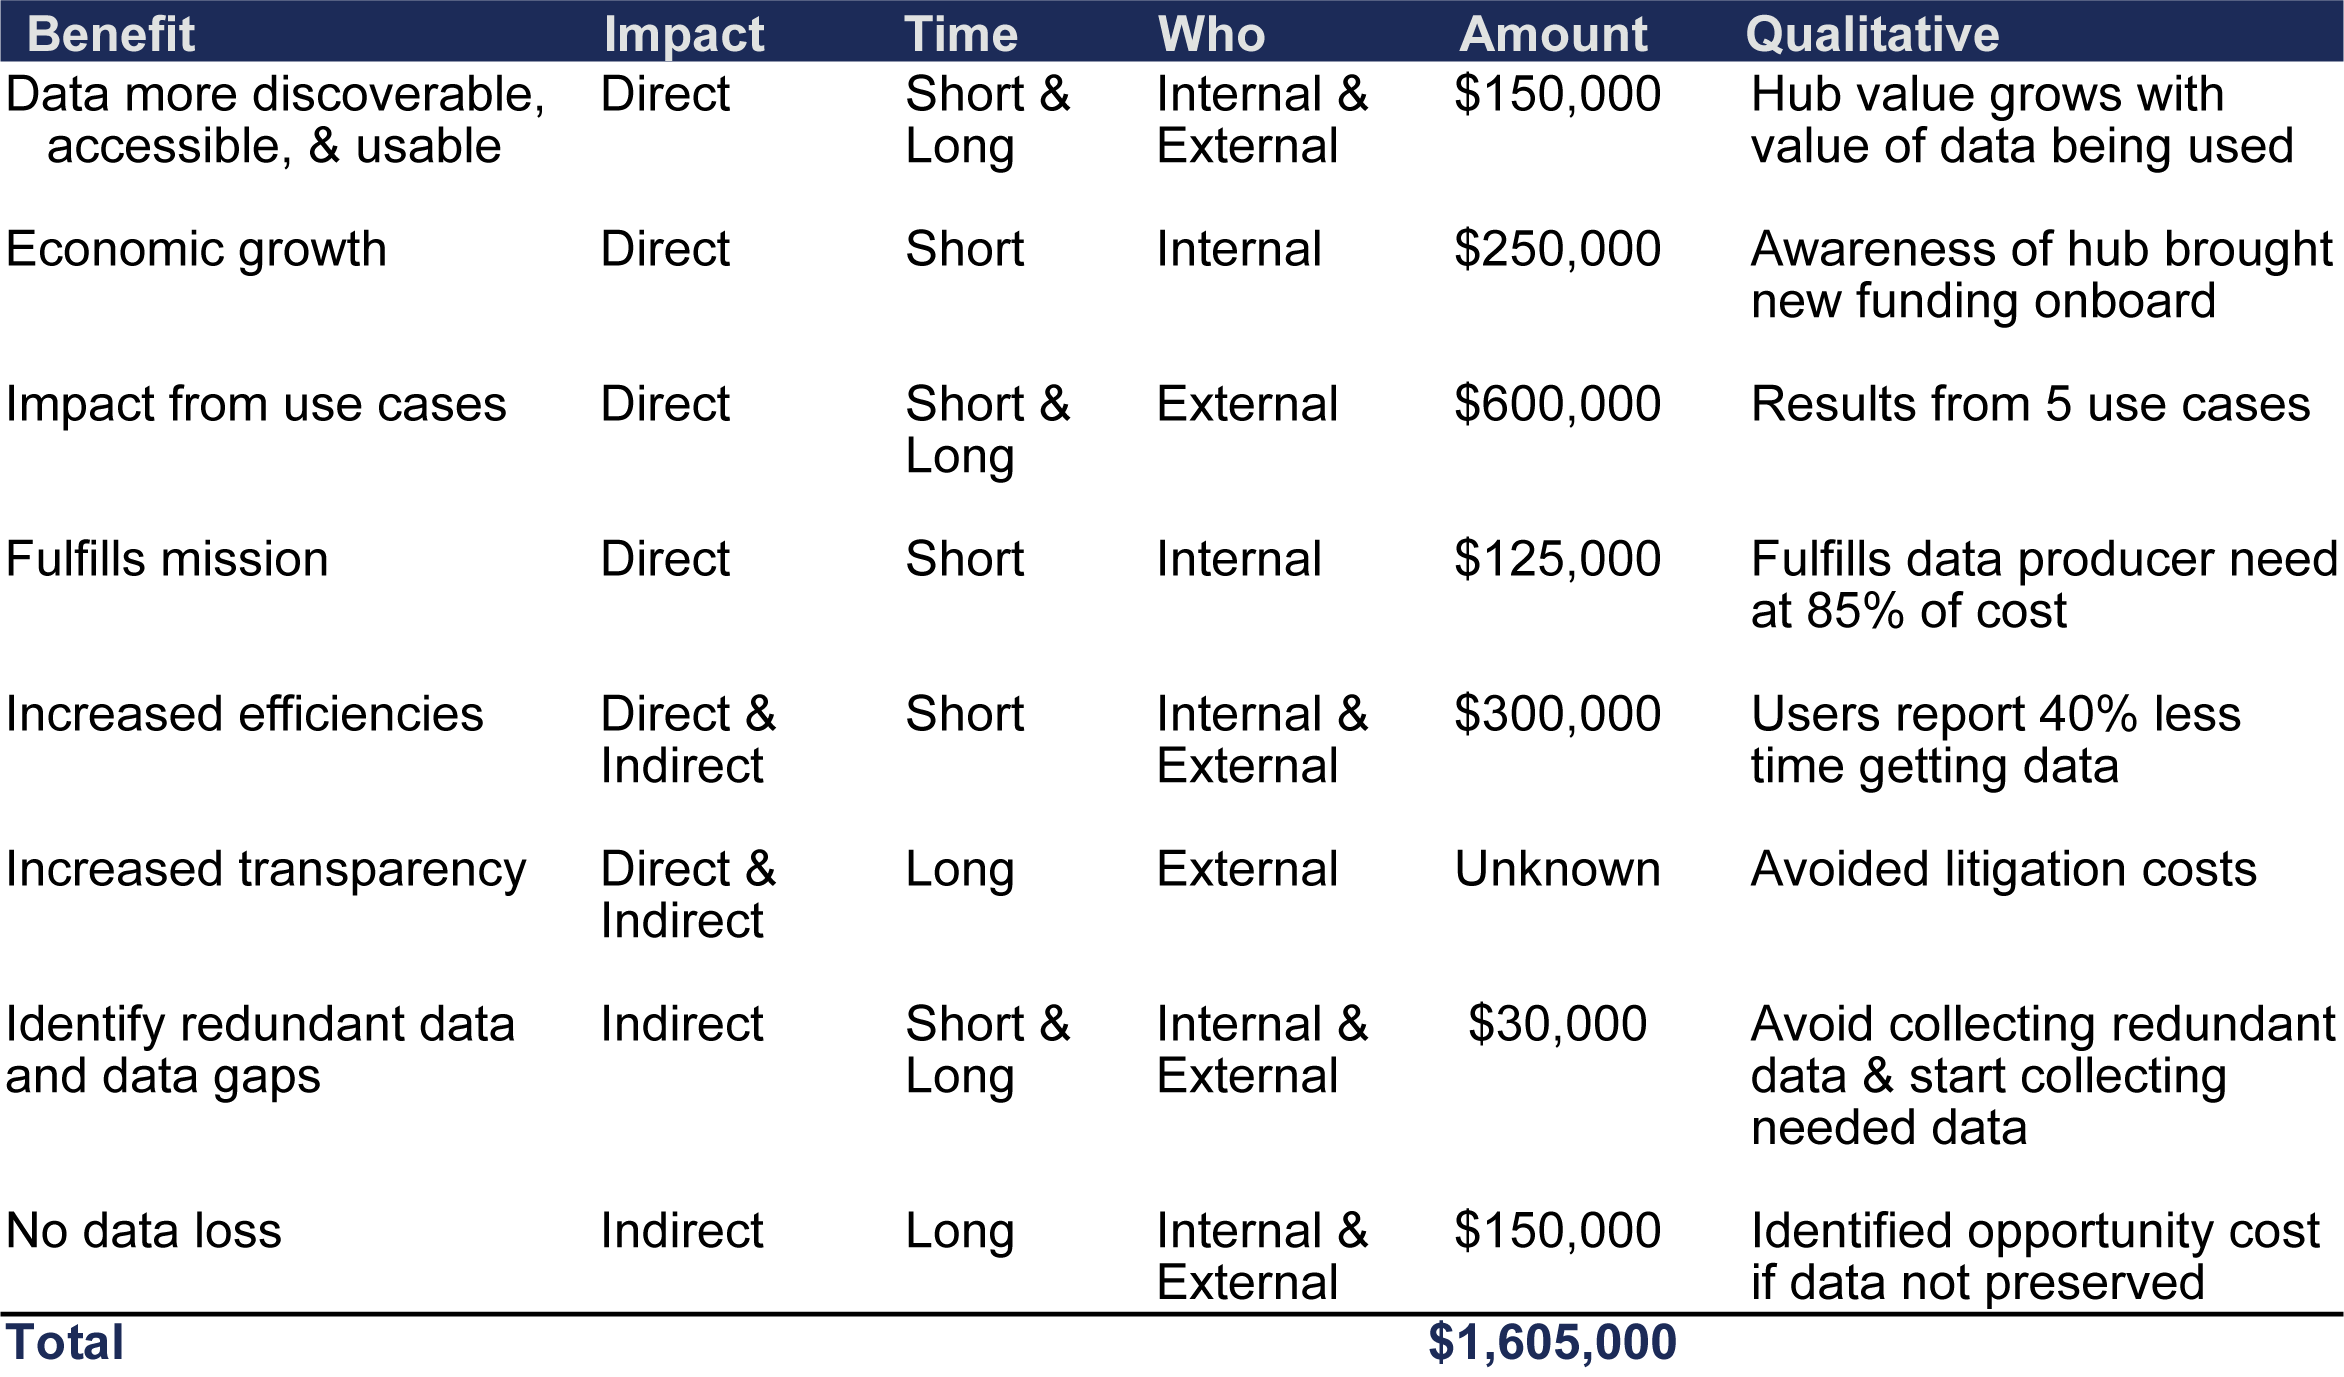
The surveys of Acme Hub producers and users revealed a number of benefits that amounted to approximately $1.605M in hub value (Table 2).
Table 2: Benefits listed by survey respondents and categorized by impact, time, and who.
(3) Calculate the return on investment
Survey results by producers, hubs, and users revealed the following benefits.
- Data Producers had an estimated savings of $155,000 by hosting data on the hub, rather than their own servers. This results in cost savings of 48%, saving $2.10 for every $1 spent prior to Acme Hub.
- Data Hub had efficiency savings of $375,000. If we instead look at in internal benefits. Looking at internal cost and benefits, the hub’s ROI is 0.30 ($375,000/$1.25M). If we instead look at the benefit-to-cost ratio to account for internal and external benefits, the hub provides a $1.25 benefit for every $1 spent ($1.61M/$1.25M).
- Data Users stated they were willing to pay between $500 and $10,000 ($4,000 median) annually to access data, amounting to $240,000 for the 60 subscribed users. In addition, data users reported $850,000 in benefits from economic growth and use case impacts. In terms of improved efficiencies, data users spent 40% less time searching for data, saving $2.50 in efficiencies for every $1 spent prior to Acme Hub.
As illustrated, ROI may not be a good metric for hubs since many benefits accrue external to the hub. For example, both data producers and users experienced savings by using Acme Hub, but that does not necessarily translate into their WTP for the hub.
Final thoughts
The KRDS method is as much a planning tool as an economic valuation tool. The method allows for a range of effort from cursory to in-depth valuation. The more in-depth version looks to understand impact to internal and external producers, hubs, and users to understand the value of the hub, as well as where efficiencies have been gained and can be improved upon.
For more information:
- Bergie. 2011. A Guide to the KRDS Benefits Framework V3.
- Bergie and Hougton. 2013. The Value and Impact of the British Atmospheric Data Centre.
- Bergie, N. and J. Houghton. 2014. The Value and Impact of Data Sharing and Curation: A synthesis of three recent studies of UK research data centres.